Get 40% Off
🔥 This hedge fund gained 26.16% in the last month. Get their top stocks with our free stock ideas tool.See stock ideas

S&P 500 Index: About To Be Naughty Or Nice?

Published 11/15/2015, 12:19 AM
Updated 07/09/2023, 06:31 AM
US500
-
VIX
-
MIWO00000PUS
-

The Momentum indicator has crossed below the zero level on the following Monthly chart of the S&P 500 Index (SPX), hinting of further weakness ahead.

Major support sits around the 1700 level (confluence of the 50 MA and the 40% Fibonacci retracement level -- taken from the October 2011 lows).
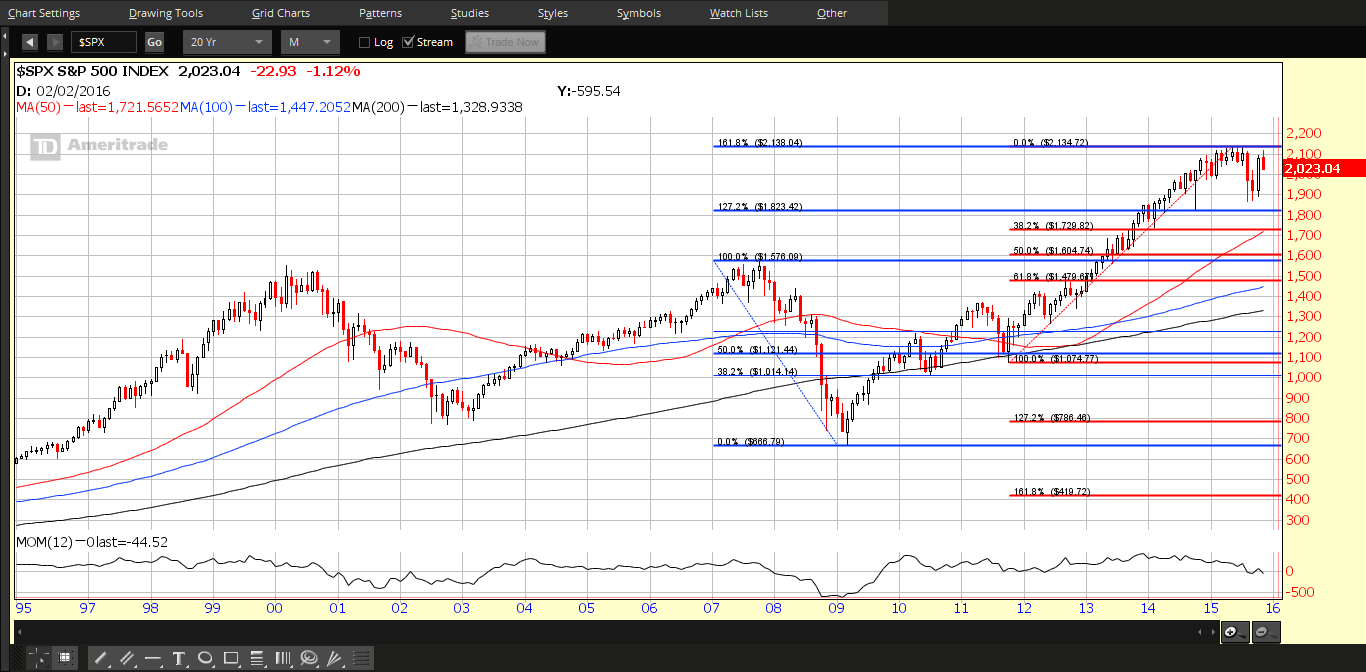
SPX Monthly 1995-2015
Price on the following Monthly ratio chart of the SPX:VIX rallied at the end of Friday to close just above the 100 level -- which is a major bull/bear line-in-the-sand level -- and, about which, I've written in numerous posts, including here.

The Momentum indicator is still well below the zero level, also hinting of further weakness ahead for the SPX.
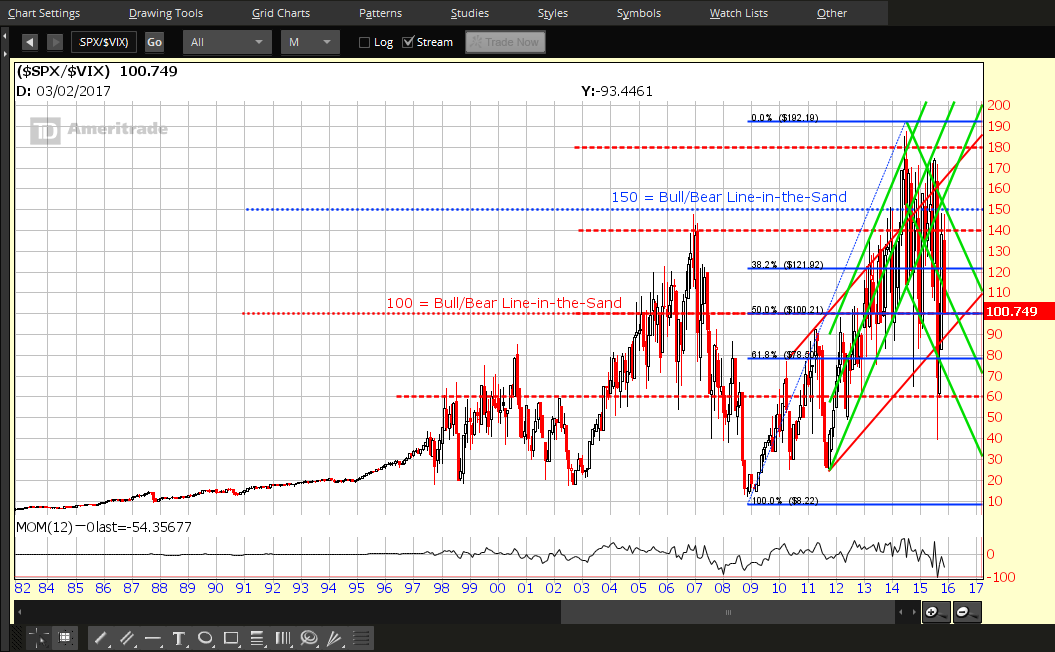
SPX:VIX Monthly 1982-2015
Price on the following Daily chart of the World Market Index did eventually drop to re-test the 1600 level, which was mentioned as a possibility in my above-referenced posts. It, subsequently, bounced and has now fallen back and closed below what was near-term major price support (now major resistance) at 1700 and the 200 MA.

Unless we see price rally and the RSI climb back (and stay) above the 50 level, we could very well see this Index plunge back to 1600, or lower. As of now, all three indicators on this chart contain "SELL" signals...and, in fact, the RSI has now broken its recent uptrend, which, also, suggests further weakness to follow.
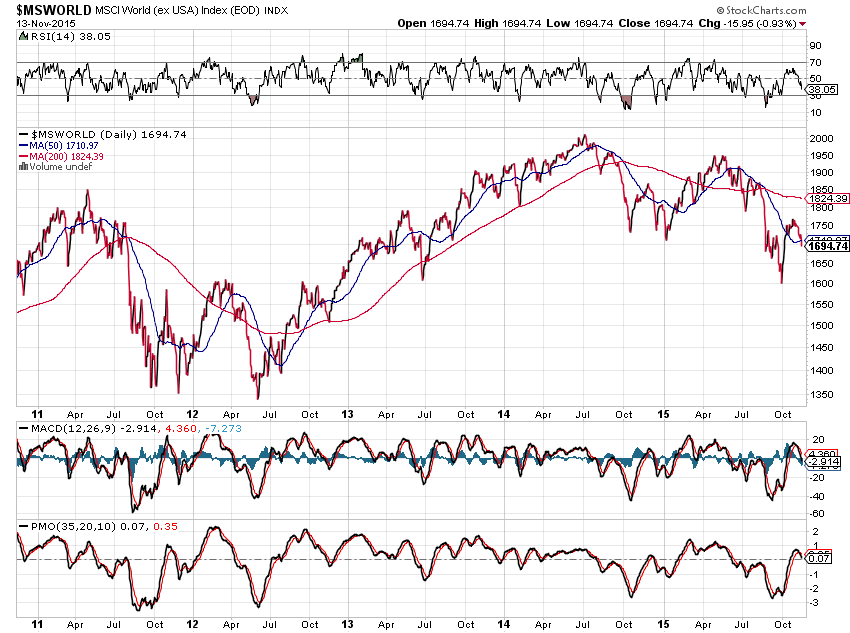
MS World Index Daily
Unless we see major buying step in soon for the SPX and the World Market Index, equity markets may very well be in for a lump of coal for Xmas -- and, my 2015 Market Forecast may prove to be fairly accurate -- as of today, there are only six weeks until then.

3rd party Ad. Not an offer or recommendation by Investing.com. See disclosure here or remove ads .

These three charts should provide clues as to any strengthening or continued weakness in the coming days/weeks.

Latest comments

Risk Disclosure: Trading in financial instruments and/or cryptocurrencies involves high risks including the risk of losing some, or all, of your investment amount, and may not be suitable for all investors. Prices of cryptocurrencies are extremely volatile and may be affected by external factors such as financial, regulatory or political events. Trading on margin increases the financial risks.
Before deciding to trade in financial instrument or cryptocurrencies you should be fully informed of the risks and costs associated with trading the financial markets, carefully consider your investment objectives, level of experience, and risk appetite, and seek professional advice where needed.
Fusion Media would like to remind you that the data contained in this website is not necessarily real-time nor accurate. The data and prices on the website are not necessarily provided by any market or exchange, but may be provided by market makers, and so prices may not be accurate and may differ from the actual price at any given market, meaning prices are indicative and not appropriate for trading purposes. Fusion Media and any provider of the data contained in this website will not accept liability for any loss or damage as a result of your trading, or your reliance on the information contained within this website.
It is prohibited to use, store, reproduce, display, modify, transmit or distribute the data contained in this website without the explicit prior written permission of Fusion Media and/or the data provider. All intellectual property rights are reserved by the providers and/or the exchange providing the data contained in this website.
Fusion Media may be compensated by the advertisers that appear on the website, based on your interaction with the advertisements or advertisers.
© 2007-2024 - Fusion Media Limited. All Rights Reserved.