The investment world is swirling with speculation and argument about whether the current S&P 500 correction will end with a return to gains, or descend into a Bear market. As Jim Cramer said recently, “this market stinks”.
We have been reporting negative breadth measured by:
- new highs and lows
- advancing and declining issues
- advancing and declining volume
- equal weight to market-cap weighted indexes.
Our recent article about those factors is here.
We have been holding out on completely tossing in the towel because of the still supportive yield curve, which has almost always gone flat before a Bear market — although we have phased into substantial cash positions ranging from 50% to 100% for clients whose investment mandates call for such tactical actions. I am personally 75% cash at this time.
We will be publishing another article this weekend about our monthly 4 factor market trend reversal indicator that is currently 75% confirmed of a trend reversal in formation. Our recent article using the indicator on sectors is here.
An important trend reversal pattern may be forming in the S&P 500 price chart — a Head & Shoulders pattern.
StockCharts.com describes Head & Shoulders this way:
“A Head and Shoulders reversal pattern forms after an uptrend, and its completion marks a trend reversal. The pattern contains three successive peaks with the middle peak (head) being the highest and the two outside peaks (shoulders) being low and roughly equal. The reaction lows of each peak can be connected to form support, or a neckline. … The head and shoulders pattern is one of the most common reversal formations. It is important to remember that it occurs after an uptrend and usually marks a major trend reversal when complete.”
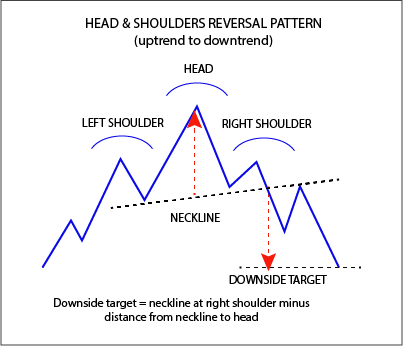
Figure 1 is a stylized diagram of a Head & Shoulders pattern, including the implied downside target price.
FIGURE 1:
The basic idea is that an uptrend becomes a downtrend with the price drops from the right shoulder and crosses below the neckline. At that point, a long exit or short entry is indicated.
Head & Shoulders patterns occur in all time frames from tick-by-tick, to day-by-day, to week-by-week, to month-by-month, and perhaps year-by-year.
Traders focus and act upon the short period H&S patterns, while tactical investors may focus on intermediate period H&S patterns; and strategic investors may focus on longer term H&S patterns — Buy & Hold investors don’t care (I guess).
We focus mainly on monthly periods, but the daily periods H&S patterns seems to be confirming our monthly period data that suggests a major trend reversal is a distinct near-term probability.
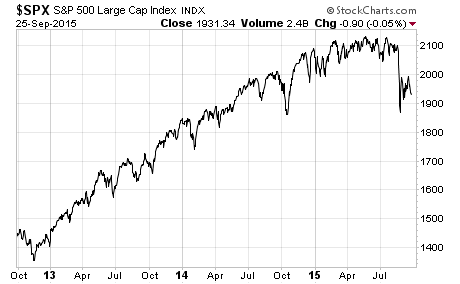
Figure 2 is a simple daily line chart for the past three years, in which some of the attributes of an H&S pattern may be visible.
FIGURE 2:
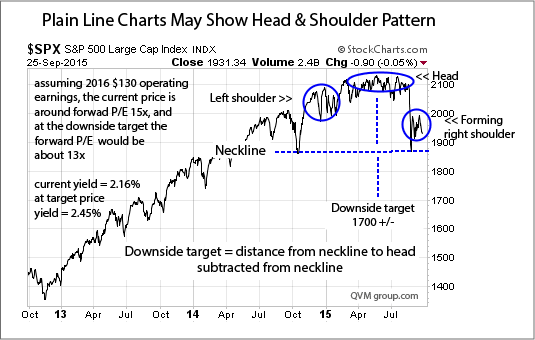
Figure 3 annotates Figure 2 to declare the left shoulder, head, right shoulder and neckline of the possible H&S pattern. It also roughly estimates the downside target price in the 1700+/- area.
Note that the current forward operating earnings P/E is around 15x, and at the downside target price it would be around 13x. The current yield is 2.16% and would rise to about 2.45% at the downside target price.
FIGURE 3:
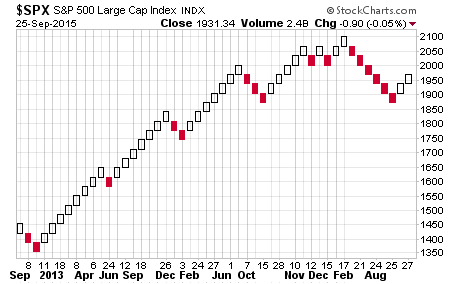
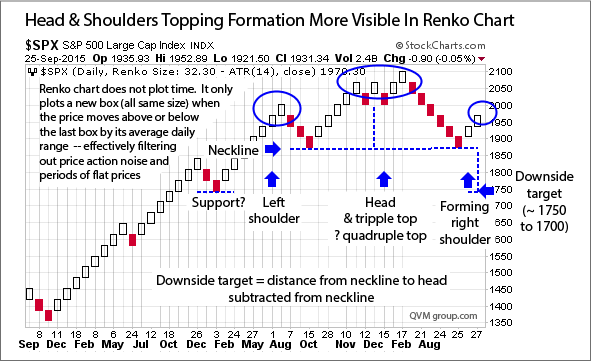
We must admit that the formation of the H&S pattern is not in any way crisp or clear. What caught our attention was a Renko chart of the index (see StockCharts.com description). That made both a triple top (maybe quadruple top) and an H&S pattern seem to pop out. Triple tops and H&S patterns are both reversal patterns, and to have them simultaneously is even more concerning.
Figure 4 shows the Renko chart.
FIGURE 4:
Figure 5 annotates the Renko chart to illuminate the H&S pattern.
FIGURE 5:
The H&S is not fully formed and may be washed away like sand castles as the ocean high tide returns, but so far it is an intriguing possibility.
If the S&P 500 goes below about 1875, lookout for a possible 1700 (about 20% below the trailing 1-year high of 2132 — a 20% Bear market decline.)
Directly related funds are S&P 500 funds such as SPDR S&P 500 (NYSE:SPY), iShares Core S&P 500 (NYSE:IVV), Vanguard S&P 500 (NYSE:VOO) and VINFX — but if we have a bear market, virtually all US equity funds and individual stocks are likely to be sucked into the whirlpool of declining prices. Correlations approach 1.00 in the early stage of rapid decline in a Bear market.

