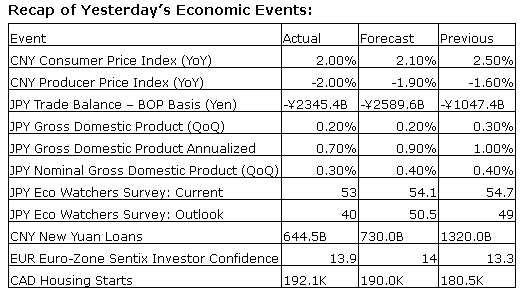
Upcoming US Events for Today:
- NFIB Small Business Optimism Index for February will be released at 7:30am. The market expects 94.0 versus 94.1 previous.
- Job Openings and Labor Turnover Survey for January will be released at 10:00am. The market expects 4.00M versus 3.99M previous.
- Wholesale Trade for January will be released at 10:00am. The market expects a month-over-month increase of 0.4% versus an increase of 0.3% previous.
Upcoming International Events for Today:
- German Merchandise Trade for January will be released at 3:00am EST. The market expects 15.0B versus 14.2B previous.
- Great Britain Industrial Production for January will be released at 5:30am EST. The market expects a year-over-year increase of 3.0% versus an increase of 1.8% previous.
- Japan Tertiary Index for January will be released at 7:50pm EST. The market expects a month-over-month increase of 0.6% versus a decline of 0.4% previous.
The Markets
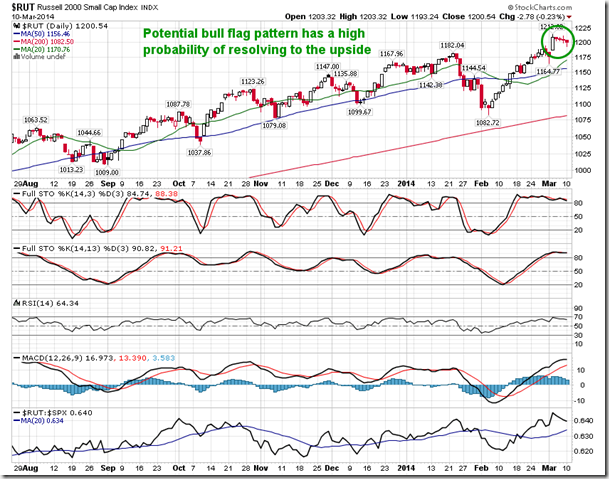
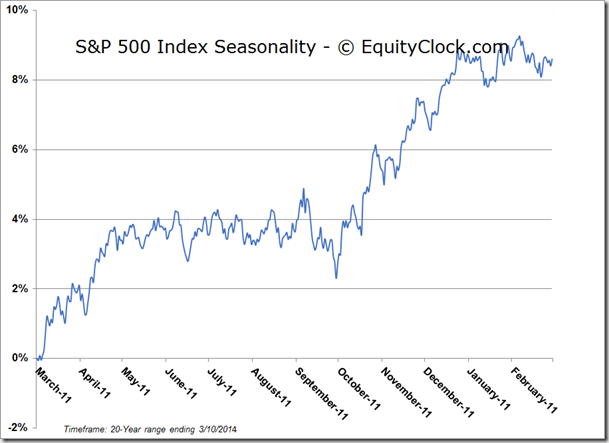
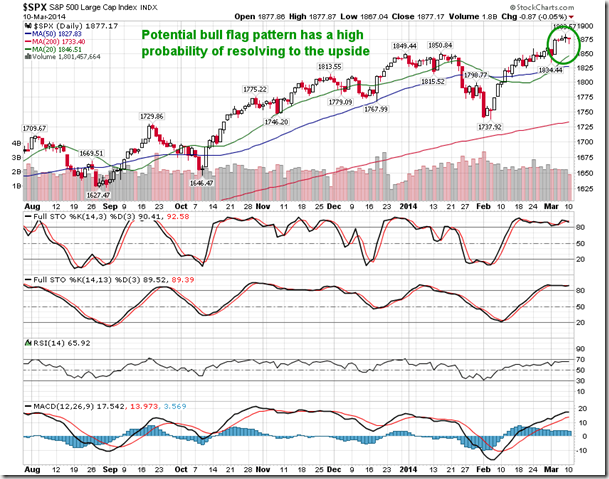
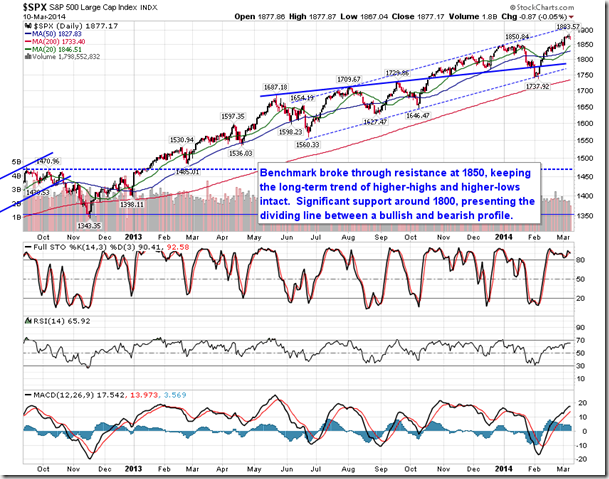
Stocks ended with marginal losses on Monday, continuing to consolidate following last week’s breakout to new all-time highs. Given the recent consolidation around the highs, both the S&P 500 and Russell 2000 index are showing what appears to be a bull flag formation, a positive setup that typically resolves to the upside once the short-term period of consolidation is complete. Major moving averages for both indices, including the 20, 50, and 200-day, continue to point higher, suggesting positive trends on a short, intermediate, and long-term basis. Volume during Monday’s session was the second lowest of the year, suggesting a lack of conviction to the minor profit taking recorded on the day; only the subdued volumes recorded on January 3rd, attributed to the end of year holiday season, were less than yesterday’s session. Seasonally, March and April are two of the strongest back-to-back months for the equity market, a trend that is well underway this year as well.
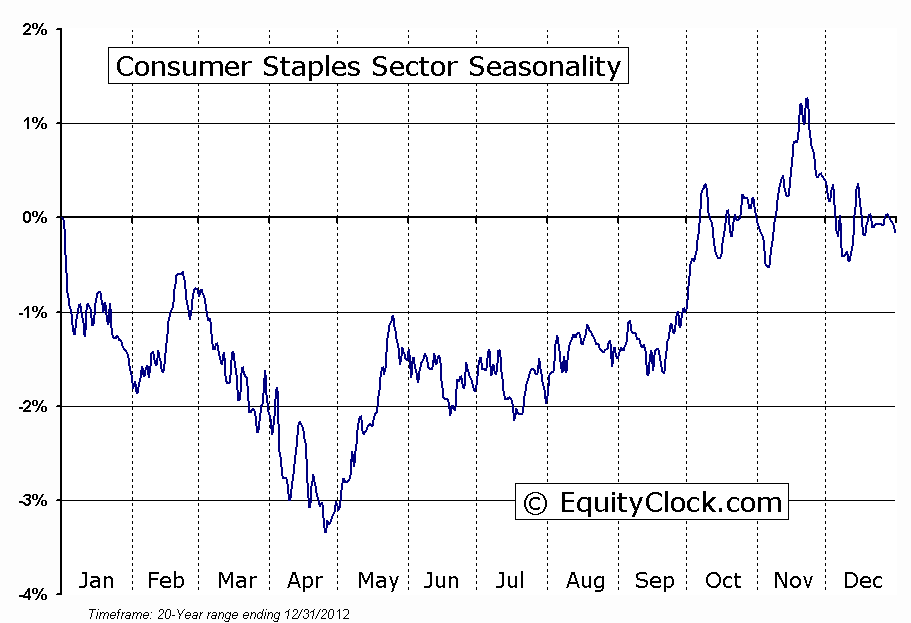
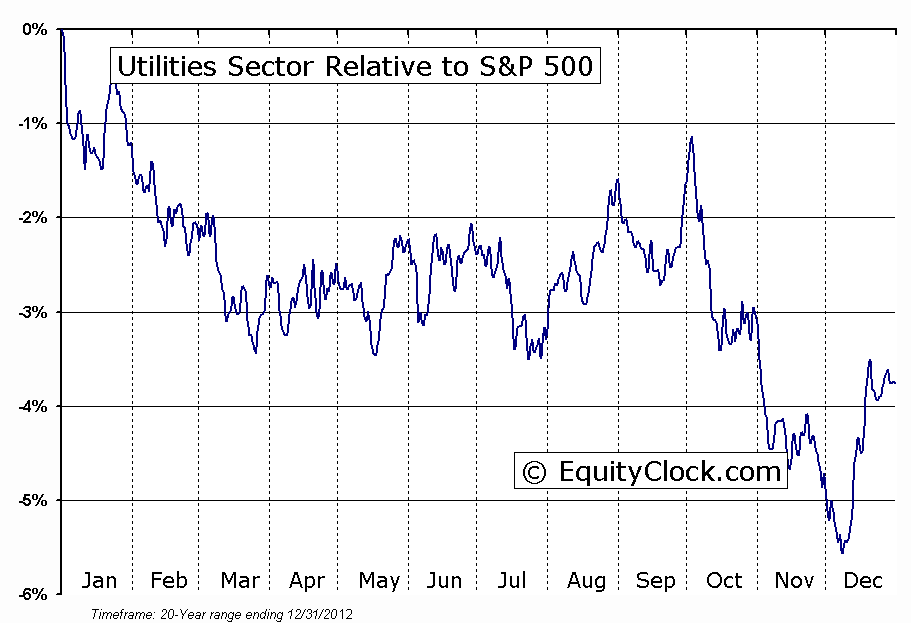
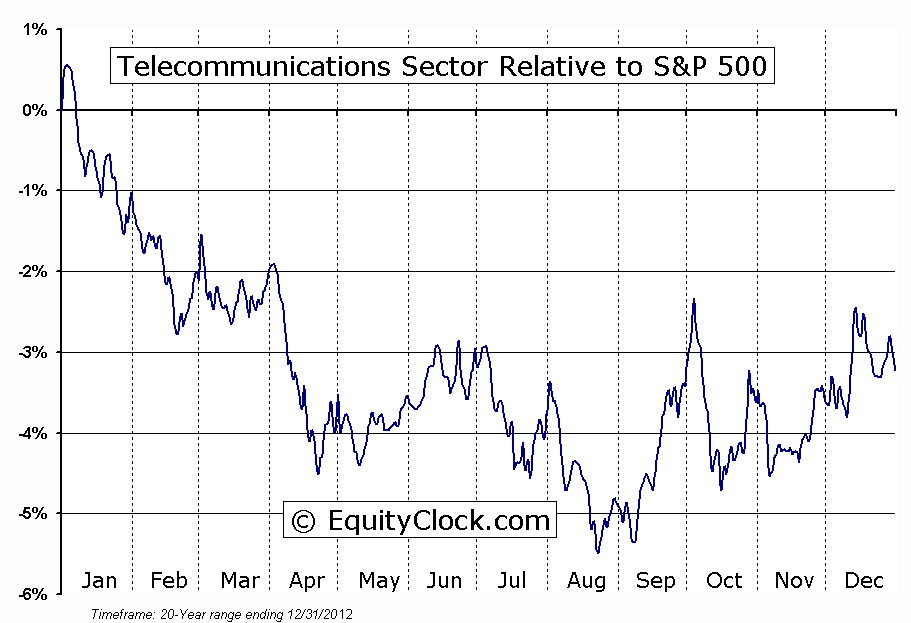
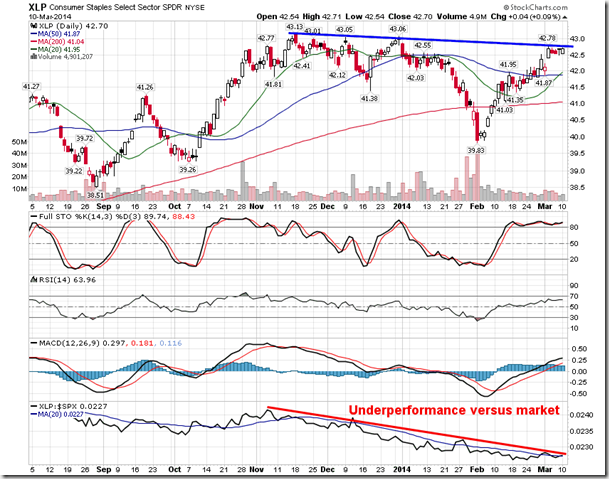
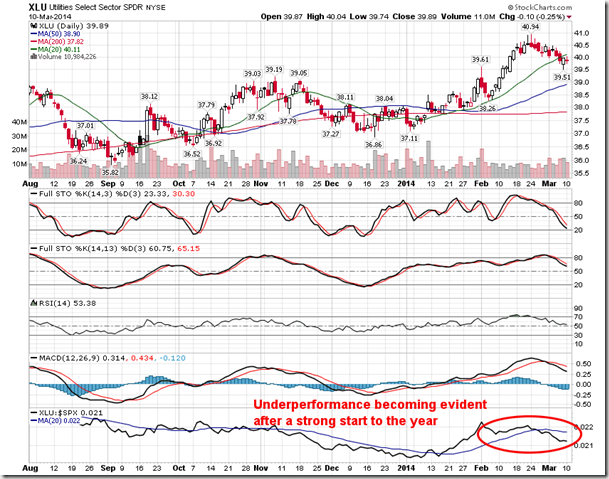
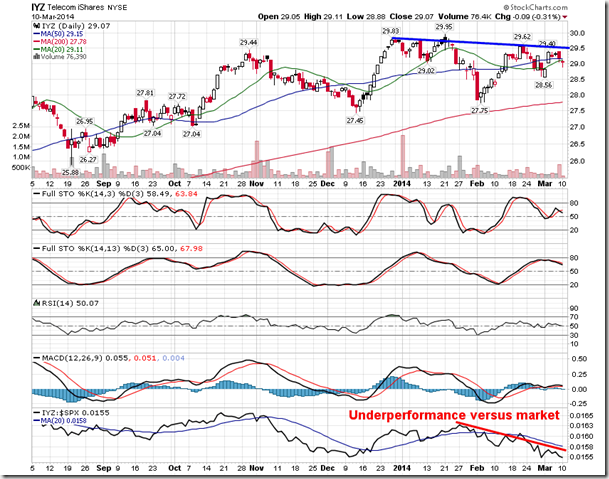
Sector performance continues to be conducive to further upside in equity markets. Defensive sectors (Consumer Staples, Utilities, and Telecom) are lagging the move higher in the broad market indices, while cyclicals are either market perform or outperforming the broad market move. Consumer Staples, Utilities, and Telecom will tend to outperform the broad market during periods of risk aversion, which often leads to broad market declines. As long as defensive sectors continue to lag and cyclicals outperform, higher equity markets should be expected. Defensive sectors remain seasonally weak through to the end of April.
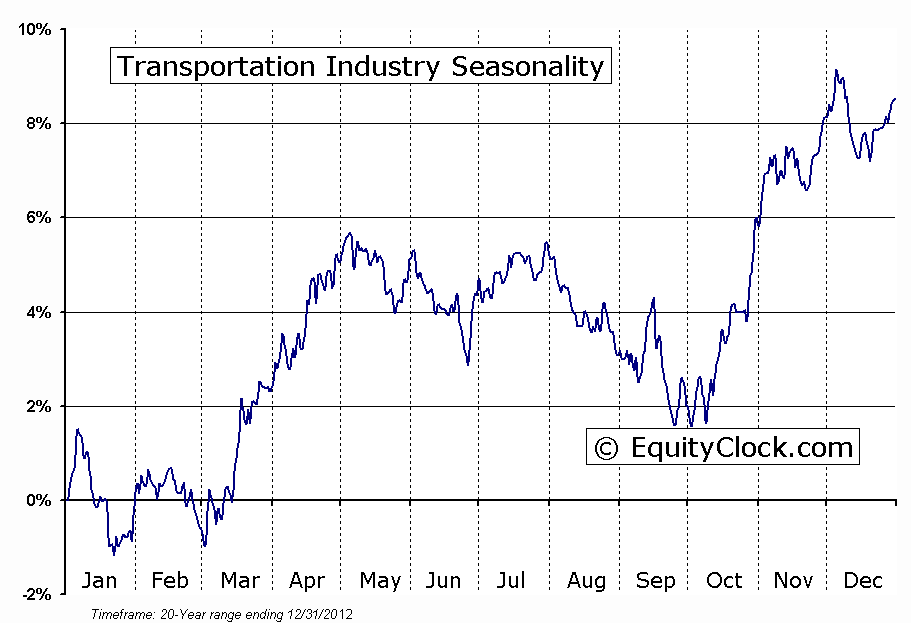
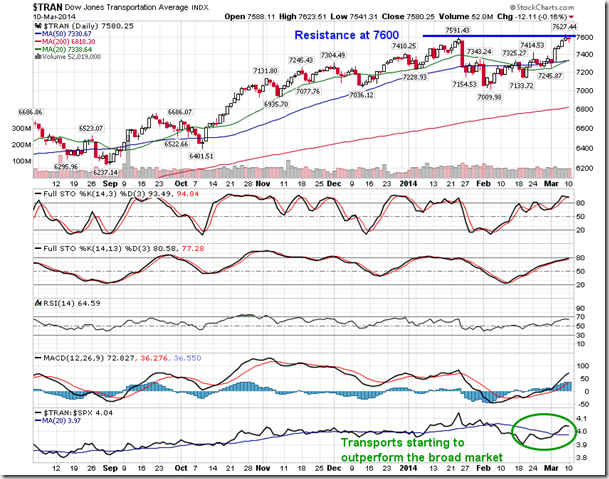
One cyclical trade is just entering its seasonal sweet spot. Transportation stocks have two periods of seasonal strength; the first being from the start of October into mid-November and the second being from the start of March into the start of May. Over the past 20 years, seasonal gains for the Transportation sector have averaged 6.41% between March 1st and May 5th. The trade has been profitable 85% of the time since 1993. The Dow Jones Transportation Average started to outperform the broad market in mid-February, setting the stage for a positive move into the period of seasonal strength. The benchmark is now consolidating around the all-time high of 7600. A breakout above resistance would likely draw further buyers in, fuelling the typical seasonal gains through the month of April.
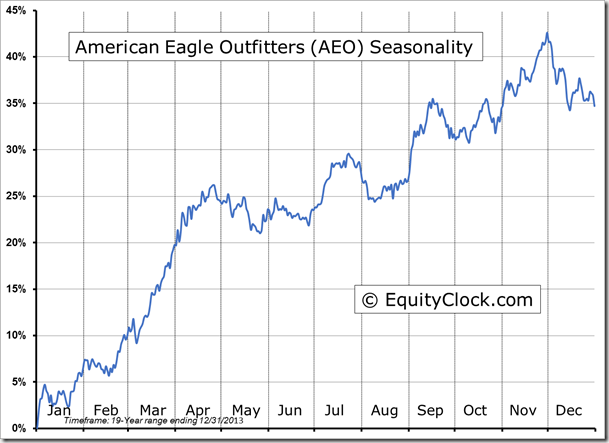
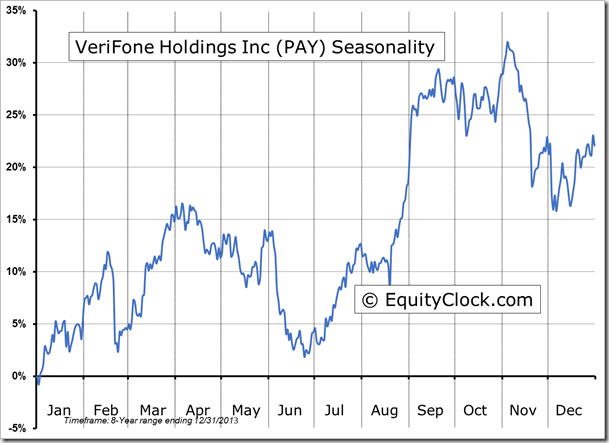
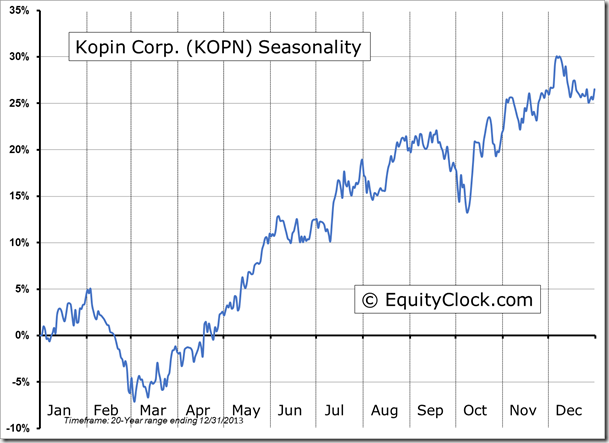
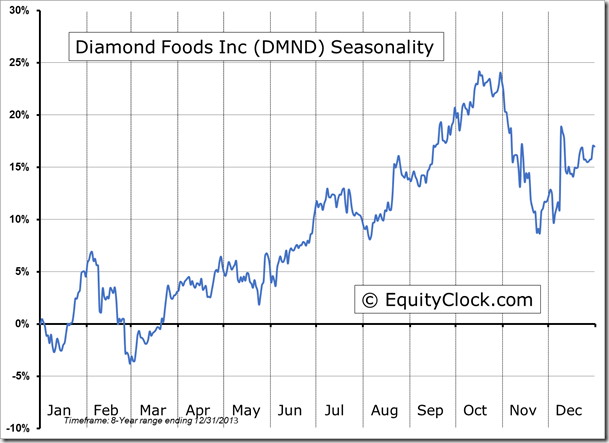
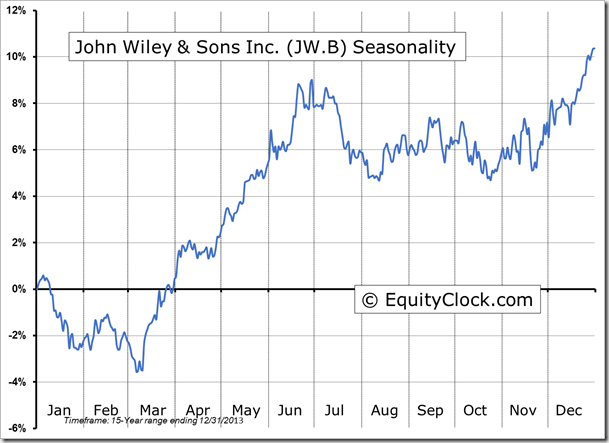
Seasonal charts of companies reporting earnings today:
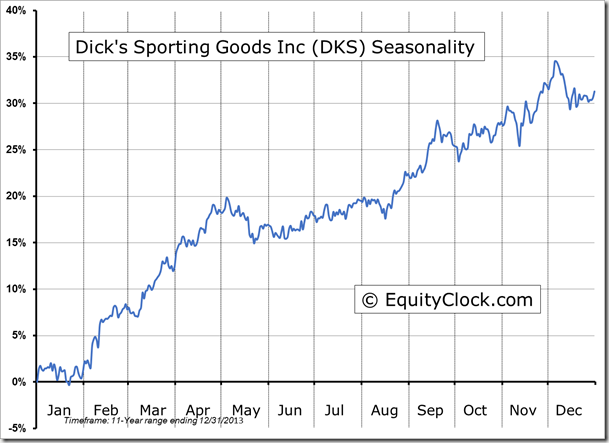
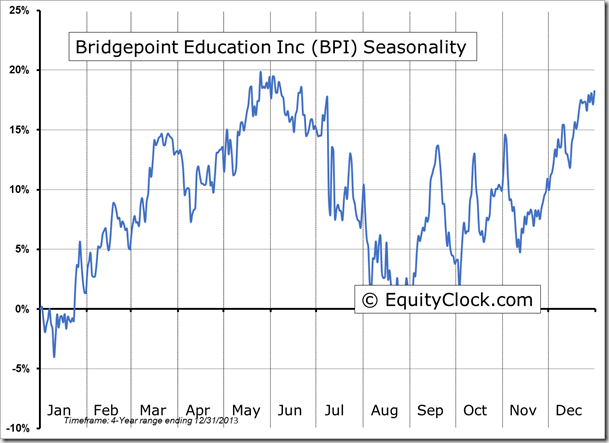
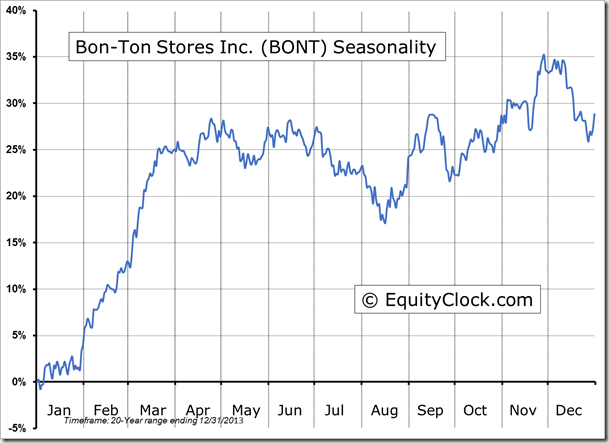
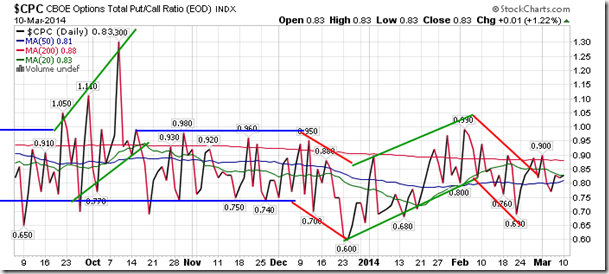
Sentiment on Monday, as gauged by the put-call ratio, ended bullish at 0.83.
S&P 500 Index
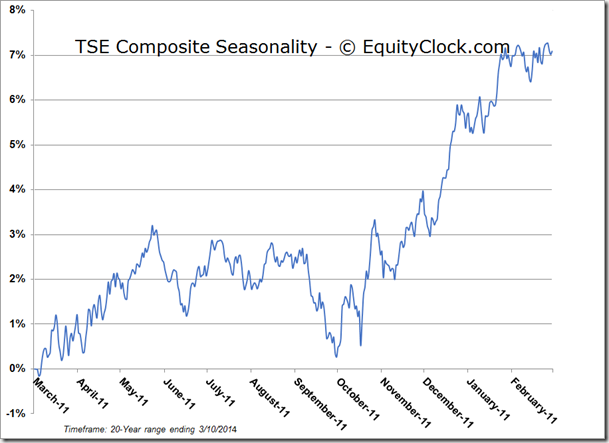
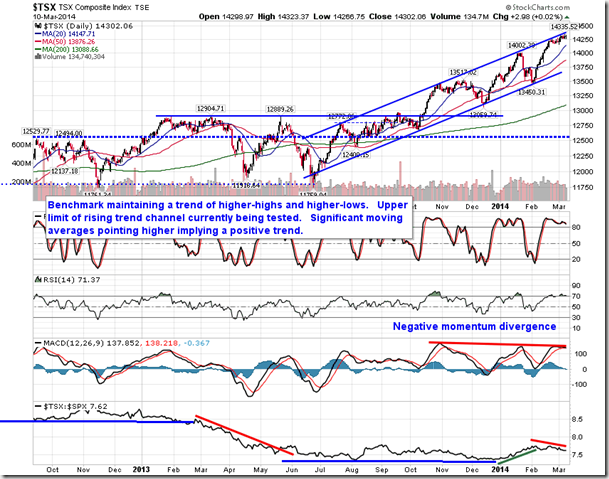
TSE Composite
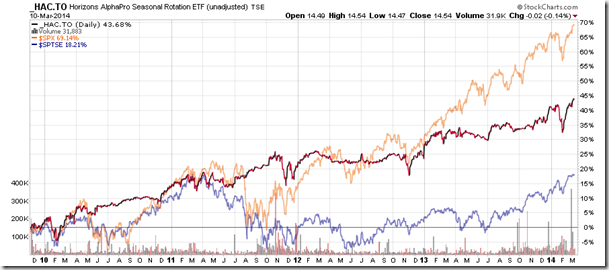
Horizons Seasonal Rotation ETF (TSX:HAC)
- Closing Market Value: $14.54 (down 0.14%)
- Closing NAV/Unit: $14.55 (down 0.07%)
Performance*
| 2014 Year-to-Date | Since Inception (Nov 19, 2009) | |
| HAC.TO | 1.75% | 45.5% |
* performance calculated on Closing NAV/Unit as provided by custodian