
Ryder System’s (NYSE:R) second-quarter 2019 earnings (excluding 3 cents from non-recurring items) of $1.4 per share came in line with the Zacks Consensus Estimate. However, the bottom line declined year over year due to below-par used vehicle sales.
Total revenues amounted to $2,245 million, which lagged the Zacks Consensus Estimate of $2,255.5 million. The top line, however, increased 7.5% year over year.
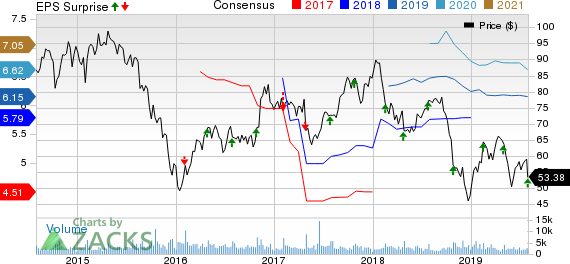
More than the revenue miss and the year-over-year earnings contraction, the company’s bearish bottom-line projections for third-quarter and full-year 2019 disappointed investors. Consequently, the stock declined 10% to $53.38 per share on Jul 30.
For third-quarter 2019, the company anticipates adjusted earnings per share between $1.45 and $1.60 compared with $1.67 registered a year ago. The Zacks Consensus Estimate for third-quarter earnings is pegged higher at $1.74.
For 2019, Ryder, carrying a Zacks Rank #3 (Hold), anticipates adjusted earnings per share between $5.50 and $5.80 (earlier view: $6.05 to $6.35). The Zacks Consensus Estimate for full-year earnings is pegged higher at $6.15. The company trimmed its 2019 earnings guidance as it expects weakness pertaining to used vehicle sales to persist during the current year.
You can see the complete list of today’s Zacks #1 Rank (Strong Buy) stocks here.
Segmental Results
Fleet Management Solutions (FMS): Total revenues at this segment amounted to $1.39 billion, which rose 7% year over year. Operating revenues (excluding fuel) summed $1.18 billion, up 9% year over year. Segmental results were driven by larger average fleet size and favorable pricing of new vehicles. Notably, the lease fleet increased sequentially by 3,800 vehicles.
Dedicated Transportation Solutions (DTS): At this segment, total revenues summed $362.2 million, up 10% from the year-ago quarter. Operating revenues (excluding fuel and subcontracted transportation) rose 16% to $248.1 million backed by the expansion of the customer base among other factors.
Supply Chain Solutions (SCS): Total revenues at this segment were $649.3 million, which increased 7% year over year. Operating revenues (excluding fuel and subcontracted transportation) improved 12% year over year to $483 million. Segmental results were driven by volume growth, favorable pricing and other factors.
Ryder System, Inc. Price, Consensus and EPS Surprise
Ryder System, Inc. price-consensus-eps-surprise-chart | Ryder System, Inc. Quote
Other Details
Ryder exited the second quarter with cash and cash equivalents of $92.5 million compared with $68.1 million at the end of 2018. The company had total debt of $7,672.3 million compared with $6,649 million at 2018 end.
As the company is investing substantially in its lease and rental fleets, capital expenditures (net) surged 53.9% year over year to $2 billion during the first half of 2019. Operating cash flow totaled $1.05 billion, up 21.4% year over year.
Outlook
Capital expenditures are expected to remain high in 2019 (anticipated to be $3.7 billion) due to increased investments by Ryder toward expanding its fleet. As a result, free cash flow is estimated to be at negative $1.12 billion in the current year.
Upcoming Releases
Investors interested in the Zacks Transportation sector are keenly awaiting second-quarter 2019 earnings reports from key players such as GOL Linhas (NYSE:GOL) , Hertz Global Holdings (NYSE:HTZ) and Air Lease Corp. (NYSE:AL) . While GOL Linhas will report second-quarter earnings on Aug 1, Hertz Global and Air Lease will announce the same on Aug 6 and Aug 8, respectively.
More Stock News: This Is Bigger than the iPhone!
It could become the mother of all technological revolutions. Apple (NASDAQ:AAPL) sold a mere 1 billion iPhones in 10 years but a new breakthrough is expected to generate more than 27 billion devices in just 3 years, creating a $1.7 trillion market.
Zacks has just released a Special Report that spotlights this fast-emerging phenomenon and 6 tickers for taking advantage of it. If you don't buy now, you may kick yourself in 2020.
Click here for the 6 trades >>
Gol Linhas Aereas Inteligentes S.A. (GOL): Free Stock Analysis Report
Ryder System, Inc. (R): Free Stock Analysis Report
Air Lease Corporation (AL): Free Stock Analysis Report
Hertz Global Holdings, Inc (HTZ): Free Stock Analysis Report
Original post
Zacks Investment Research