There’s one important – possible – exception to this potential outcome from the latest Europe’s-Been-Saved Rally and that is the Russell 2000 – or perhaps it is an extreme version of why last week’s 3% surge in the equity indices will reverse soon – but let’s leave its chart until the end and start with why it appears that the latest sideways swipe up is likely to result in a sideways swipe down.
First, there’s the possible Double Top playing with the S&P, Dow Jones Industrial Average and the Nasdaq Composite with each of the hourly charts slightly different and worth looking at for the nuances before turning to the important daily charts that fail to show consolidation – the hallmark of a successful Runaway Day – in favor of topping and the key signal of a Runaway Day that is likely to lead to a reversal back down.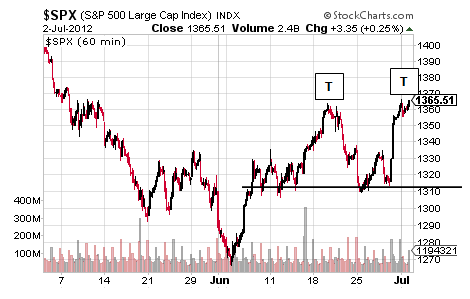
Starting out with the S&P above, there is the Double Top highlighted Monday in daily form and a pattern that confirms at 1309 for a target of 1255 and the chart above with the line of confirmation draw a tad high shows why this pattern is likely to work and that is Newton’s Third Law relative to the move up for nearly the first three weeks of June. Unless the S&P closes above 1371 and the top of the index’s two-year sideways trend, this Double Top should take the S&P back down and probably pretty quickly and perhaps on payrolls.
Naturally what will really determine whether Friday’s spike up will turn out to be a successful Runaway Day that signals a move much higher or a failed Runaway Day for the aforementioned reversal is whether Monday’s trading was the beginning of consolidation or topping.
Charts being as fractal as life, it is interesting to note that there may be a small Double Top up there but it could turn out to be a small Bull Triangle of some sort and this is where the Dow’s 60-minute chart comes in handy as shown on the following page.
Putting aside its own Double Top that Formed in the month of June, Monday’s trading appears to have formed an identifiable topping pattern and that is none other than the Diamond Top that breaks to the downside more often than not. Let’s treat both cases with times being unusual as ever and the upside scenario confirms at 12902 for a headline-stealing target of 13006 while the downside confirms at 12798 for a target of 12694.
Its Double Top confirms at 12450 for an attention-grabbing target of 12001 with perhaps that equal and opposite reaction force showing better in the month chart below.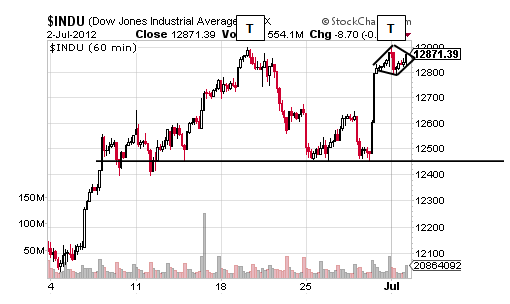
It is the chart of the Nasdaq Composite, however, that really points to the likely failure of last Friday as a Runaway Day and that is due to its huge gap into what is likely to be the second peak to a Double Top.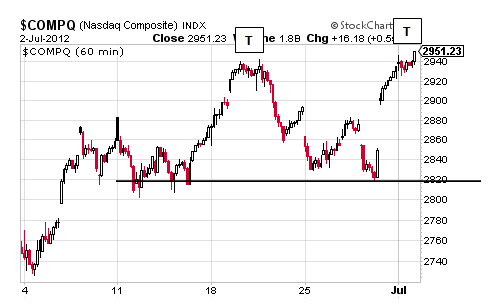
Should this prove true, the pattern confirms at 2820 for a target of 2689, and thus a top heavy pattern relative to the most supporting it early in June and perhaps another reason to think it will collapse down sooner rather later.
Before turning to the daily chart of the Dow for a look at whether Friday looks more like a successful or a failed Runaway Day, let’s take a look at the Russell 2000 that rose another 1.18% yesterday.
Truthfully, Monday’s surge on top of last Friday’s spike up looks more like topping and particularly in the context of its previous trading and something that will be explored separately in another note shortly, but in this note let’s just look at the 3-month chart and laugh – or at least giggle.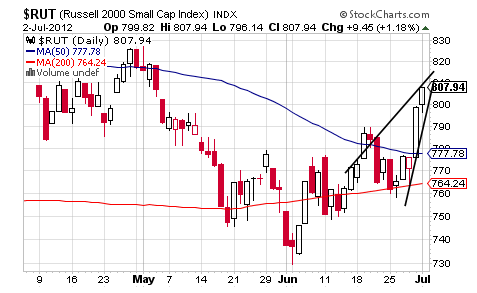
Maybe the Russell 2000’s move up Monday is the beginning of a Bull Flag or Pennant for some much-needed consolidation but the 1-min chart shows lots of little gaps at the base of Friday’s spike up while Monday’s move up closed May’s 804 gap and something that probably frees the Russell 2000 to fall back with that “payback mission” accomplished. That being said, this small cap index is pretty close to the 825 target of its unmarked “IHS” pattern and so maybe it fulfills but it does not present in weekly form while what may be presenting above is a Bear Wedge that confirms at 796 for a target of 758.
Overall, then, the Russell 2000 is probably less of an exception to the likelihood of Friday failing as a Runaway Day even as it trades separate from the other equity indices to have surged higher again Monday with all of these charts looking vulnerable to a quick swipe back down in this year’s sideways trend.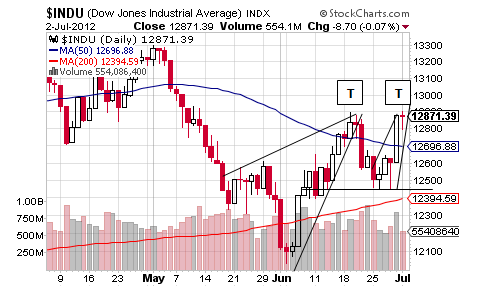
It is the Dow’s daily chart that really confirms that likelihood with Monday’s near-Doji signaling a likely reversal and something that is similar to October 28, 2011. 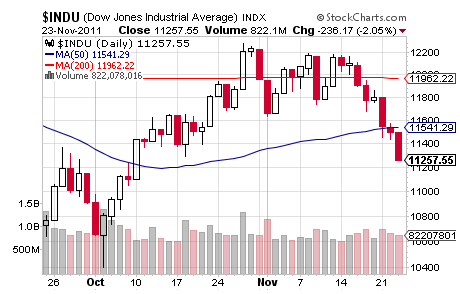
Interestingly, Monday’s candle is even similar to May 11, 2010 that led to some clear topping while it is worth noting what happened after the bearish Doji patterns that May along with the placement of the Dow in 2010 and 2012 relative to its 50 and 2000 DMAs with there being some similarity to this index’s current positioning in the context of these moving averages now.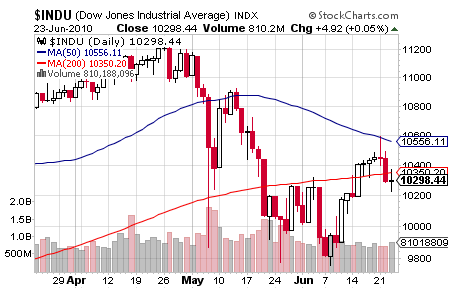
Might the Dow somehow use Monday’s trading to consolidate Friday’s spike up for a successful Runaway Day? It could but it will have to close above 12977 to defy a new Bear Wedge along with its Double Top and Rising Wedge to do so and something that seems pretty unlikely.
More likely and based on the many charts examined within is that the recent Runaway Days will reverse down.
- English (UK)
- English (India)
- English (Canada)
- English (Australia)
- English (South Africa)
- English (Philippines)
- English (Nigeria)
- Deutsch
- Español (España)
- Español (México)
- Français
- Italiano
- Nederlands
- Português (Portugal)
- Polski
- Português (Brasil)
- Русский
- Türkçe
- العربية
- Ελληνικά
- Svenska
- Suomi
- עברית
- 日本語
- 한국어
- 简体中文
- 繁體中文
- Bahasa Indonesia
- Bahasa Melayu
- ไทย
- Tiếng Việt
- हिंदी
Runaway Days Likely To Reverse Down
Published 07/04/2012, 12:03 AM
Updated 07/09/2023, 06:31 AM
Runaway Days Likely To Reverse Down
3rd party Ad. Not an offer or recommendation by Investing.com. See disclosure here or
remove ads
.
Latest comments
Install Our App
Risk Disclosure: Trading in financial instruments and/or cryptocurrencies involves high risks including the risk of losing some, or all, of your investment amount, and may not be suitable for all investors. Prices of cryptocurrencies are extremely volatile and may be affected by external factors such as financial, regulatory or political events. Trading on margin increases the financial risks.
Before deciding to trade in financial instrument or cryptocurrencies you should be fully informed of the risks and costs associated with trading the financial markets, carefully consider your investment objectives, level of experience, and risk appetite, and seek professional advice where needed.
Fusion Media would like to remind you that the data contained in this website is not necessarily real-time nor accurate. The data and prices on the website are not necessarily provided by any market or exchange, but may be provided by market makers, and so prices may not be accurate and may differ from the actual price at any given market, meaning prices are indicative and not appropriate for trading purposes. Fusion Media and any provider of the data contained in this website will not accept liability for any loss or damage as a result of your trading, or your reliance on the information contained within this website.
It is prohibited to use, store, reproduce, display, modify, transmit or distribute the data contained in this website without the explicit prior written permission of Fusion Media and/or the data provider. All intellectual property rights are reserved by the providers and/or the exchange providing the data contained in this website.
Fusion Media may be compensated by the advertisers that appear on the website, based on your interaction with the advertisements or advertisers.
© 2007-2024 - Fusion Media Limited. All Rights Reserved.
