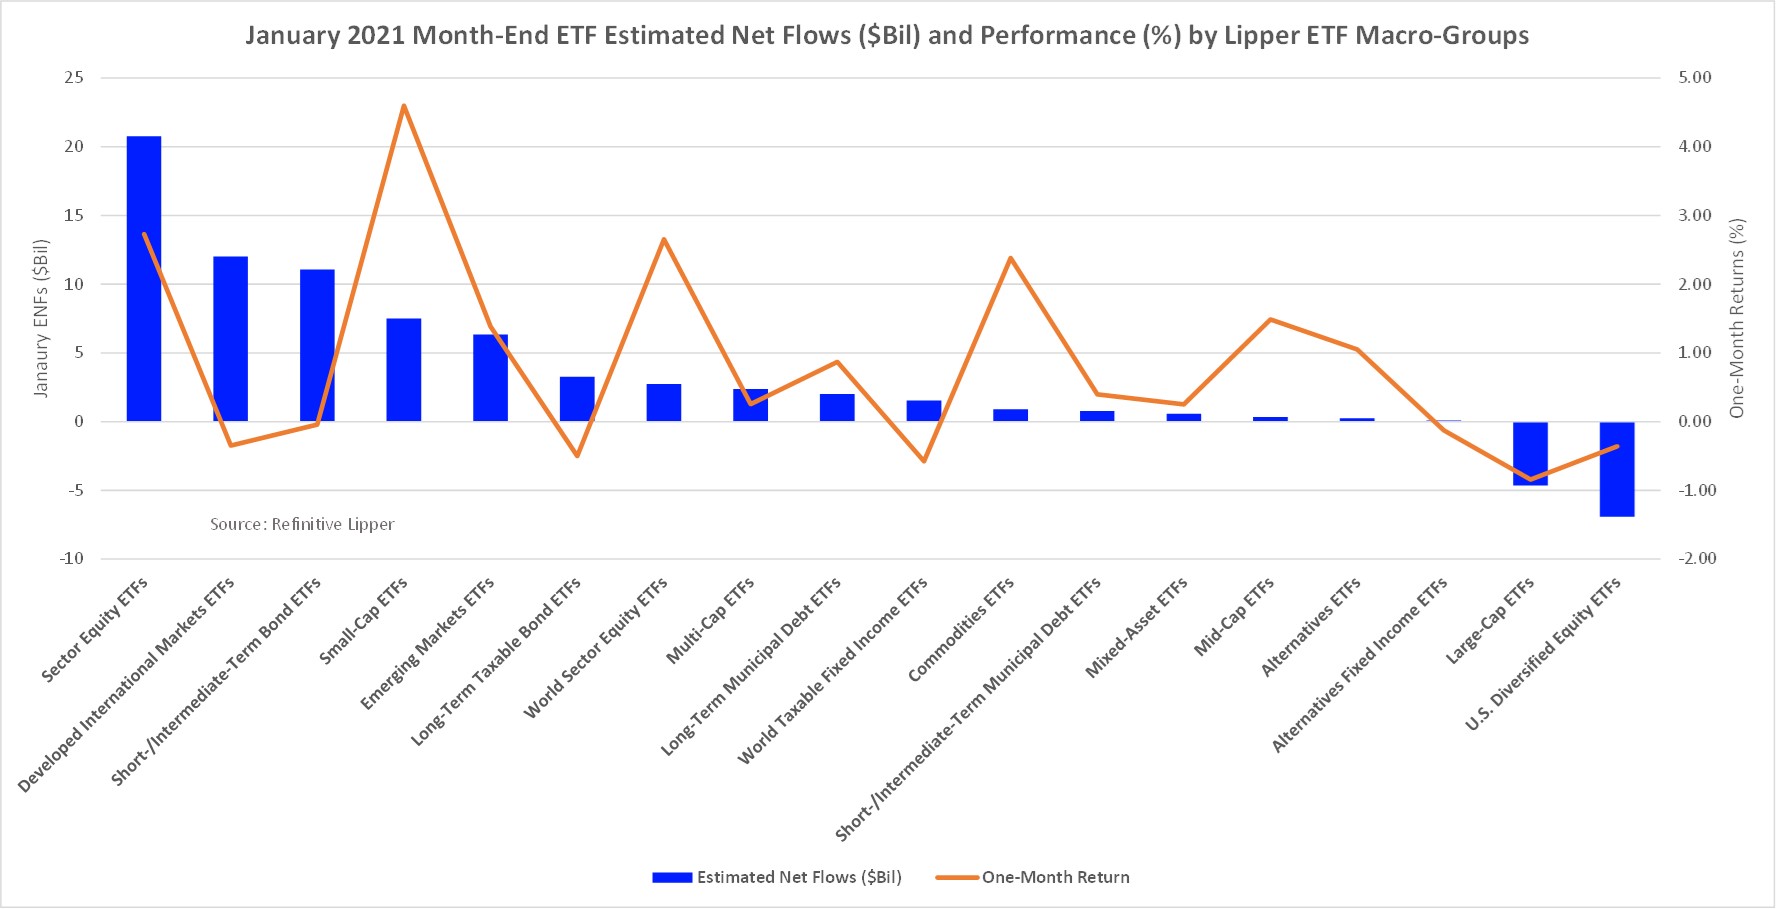
The average equity fund (including ETFs) just managed to stay in positive territory for January, posting a 0.28% return for a third consecutive month of plus-side performance. With investors beginning to turn away from the stay-at-home stocks and big tech names, we saw some performance and fund-flow leadership changes during the month.
While Lipper’s U.S. Diversified Equity Funds groups (+0.30%) remained in the black for January, we saw a definite changing of the guards as investors bid up small-cap and value-oriented issues while beating down large-cap and growth-oriented issues. At the top of the chart for this group, Small-Cap Value Funds posted a 3.72% return, while Large-Cap Growth Funds (-1.31%) suffered the second largest declines, just behind Specialty Diversified Equity Funds (-1.41%).
With investors turning toward out-of-favor issues, particularly the cyclical and energy-related issues, we saw the Commodities Funds (+2.32%) and U.S. Domestic Sector Equity Funds (+1.59%) macro-groups post the strongest returns, with Commodities Energy Funds (+5.92%) and Alternative Energy Funds (+5.91%) posting the strongest monthly returns in those groups, respectively—only outshone in the equity universe by China Region Funds (+6.06%).
However, for the one-year period ended January 31, 2021, Alternative Energy Funds (+106.44%) posted the strongest returns of all the classifications, benefitting from the tail winds of the ESG investing movement and concerns about the growing carbon impact on the economy.
Preliminary estimated net flows into exchange-traded products during the month of January confirm some of the trends mentioned above. Investors injected a net $60.9 billion into ETFs in January, with equity ETFs (+$40.5 billion) attracting the largest net inflows, followed by bond ETFs (+$18.6 billion) and commodities ETFs (+$912 million).
Looking at flows for the individual classifications, we saw Financial Services ETFs (+$6.7 billion) attract the largest amount of net new money in January as investors bet on banking stocks, which generally benefit from a rise in the yield curve. Small-Cap Core ETFs took the runner-up position, attracting $5.8 billion.
Despite the rising yield curve, the third largest draw of net new money was seen in Core Bond ETFs, which took in $5.5 billion for the month. The next two largest draws were in line with this recent concept of rotation, with Emerging Markets ETFs (+$5.3 billion) and Alternative Energy ETFs (+$4.0 billion) taking the number four and five flows positions.
The individual ETFs attracting the largest draws of net new money for January were Financial Select Sector SPDR ETF (NYSE:XLF) (+$5.0 billion), iShares Core Total USD Bond Market ETF (NASDAQ:IUSB), +$3.7 billion), iShares MSCI EAFE Value ETF (NYSE:EFV), +$3.2 billion), and iShares Core MSCI Emerging Markets ETF (NYSE:IEMG), +$3.1 billion).
In contrast, SPDR S&P 500 ETF Trust (NYSE:SPY), -$9.3 billion), iShares iBoxx $ High Yield Corporate Bond ETF (NYSE:HYG), -$4.2 billion), and Invesco QQQ Trust Series 1 (NASDAQ:QQQ), -$4.2 billion) handed back the largest sums of money for January.

