
Robert Half International Inc.’s (NYSE:RHI) third-quarter 2019 earnings came in line with the Zacks Consensus Estimate while revenues beat the same.
Quarterly earnings of $1.01 per share were up 6.3% year over year. The reported figure met the midpoint of the company’s guided range of 98 cents to $1.04.
Revenues of $1.55 billion beat the consensus mark by 0.3% and increased 5.9% year over year on a reported basis and 5.4% on an adjusted basis. Revenues were within the company’s guided range of $1.525-$1.590 billion.
Robert Half witnessed solid revenue growth in its U.S. staffing and Protiviti operations in the quarter.
Shares of Robert Half declined 4.5% over the past year compared with 3.2% decline of the industry it belongs to.

Let’s delve deeper into the numbers.
Segmental Performance
Global Staffing revenues of $1.25 billion increased 3.3% year over year on a reported basis and 3.4% on an adjusted basis. U.S. staffing revenues of $973 million increased 5.8% on a reported basis and 4.5% on an adjusted basis. Non-U.S. staffing revenues declined 4.6% on a reported basis and 0.3% on an adjusted basis to $280 million.
Currency movements had an unfavorable impact of 0.9% on staffing revenues.
The quarter had 64.1 billing days compared with 63.3 days in the year-ago quarter. At present, Robert Half operates 325 staffing locations worldwide, with 86 locations situated in 17 countries outside the United States.
Protiviti: Protiviti revenues were $299 million, which increased 18.3% year over year on a reported basis and 14.6% on an adjusted basis, with strength across the U.S. and non-U.S. regions. Protiviti revenues from the United States grew 17.5% on a reported basis and 16.2% on an adjusted basis. The same from international regions rose 21.2% on a reported basis and 9.3% on an adjusted basis.
Currency movement lowered revenue growth by 0.8% on a year-over-year basis. Currently, Protiviti, along with its independently-owned Member Firms, has a network of 86 locations in 27 countries.
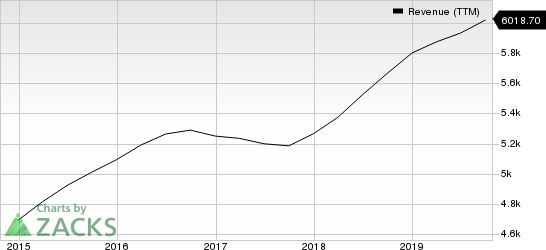
Robert Half International Inc. Revenue (TTM)
Operating Results
Gross profit in third-quarter 2019 was $646.4 million, up 5.9% year over year. Gross margin of 41.6% was flat year over year.
Operating income was $163.8 million, up 7.8% year over year. Operating margin rose to 10.5% from 10.3% in the year-ago quarter.
Selling, general and administrative expenses increased 5.3% year over year to $483.5 million.
Balance Sheet
Robert Half ended the quarter with cash and cash equivalents of $312.7 million compared with $269.4 million at the end of the previous quarter. Cash flow from operations was $191 million and capital expenditures were $17 million in the quarter.
In the quarter, Robert Half bought back around 1.5 million shares for $80 million. The company has 3.4 million shares available for repurchase under its existing repurchase plan as approved by the board of directors. It paid out $36 million in dividends.
Fourth-Quarter 2019 Guidance
Earnings are anticipated between 94 cents and $1 per share, lower than the current Zacks Consensus Estimate of $1.02. Revenues are expected between $1.5 billion and $1.565. billion, the midpoint of which is lower than the current Zacks Consensus Estimate of $1.55 billion.
The midpoints of these projections indicate year-over-year revenue decline of 1% and EPS decline of 4%.
Zacks Rank & Stocks to Consider
Robert Half currently carries a Zacks Rank #4 (Sell).
Some better-ranked stocks in the broader Zacks Business Services sector are CoreLogic (NYSE:CLGX) , S&P Global (NYSE:SPGI) and Paychex (NASDAQ:PAYX) . While CoreLogic sports a Zacks Rank #1 (Strong Buy), S&P Global and Paychex carry a Zacks Rank #2 (Buy). You can see the complete list of today’s Zacks #1 Rank stocks here.
Long-term earnings (three to five years) growth rate for CoreLogic, S&P Global and Paychex is estimated at 11%, 10% and 7%, respectively.
Today's Best Stocks from Zacks
Would you like to see the updated picks from our best market-beating strategies? From 2017 through 2018, while the S&P 500 gained +15.8%, five of our screens returned +38.0%, +61.3%, +61.6%, +68.1%, and +98.3%.
This outperformance has not just been a recent phenomenon. From 2000 – 2018, while the S&P averaged +4.8% per year, our top strategies averaged up to +56.2% per year.
See their latest picks free >>
S&P Global Inc. (SPGI): Free Stock Analysis Report
CoreLogic, Inc. (CLGX): Free Stock Analysis Report
Robert Half International Inc. (RHI): Free Stock Analysis Report
Paychex, Inc. (PAYX): Free Stock Analysis Report
Original post
Zacks Investment Research