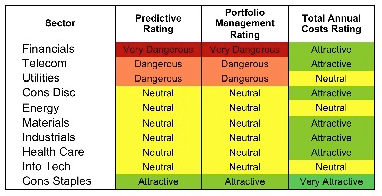
Only one sector, Consumer Staples, earns my Attractive rating. See Figure 1 for my rankings of all ten sectors. My sector ratings are based on the aggregation of my fund ratings for every ETF and mutual fund in each sector.
Investors looking for quality sector funds that hold quality stocks should look no further than the Consumer Staples, Information Technology and Health Care sectors. These three sectors house 33 of the 37 Attractive-or-better rated funds. Figures 4 and 6 provide details. The primary drivers behind an Attractive fund rating are good portfolio management, or good stock picking, and low total annual costs.
See Figures 4 through 13 for a detailed breakdown of ratings distributions by sector. My fund rating methodology is detailed here.
Figure 1: Ratings For All Sectors
Source: New Constructs, LLC and company filings
To earn an Attractive-or-better Predictive Rating, an ETF or mutual fund must have high-quality holdings and low costs. Only 37 sector ETFs and mutual funds meet these requirements, which is only 5% of all sector ETFs and mutual funds.
ICON Funds: ICON Consumer Staples Fund (ICLEX) is once again, my top Consumer Staples mutual fund. It earns my Attractive rating by allocating nearly 70% of its value to Attractive-or-better-rated stocks.
Procter & Gamble Company (PG) is one of my favorite stocks held by ICLEX. PG earns my Attractive rating because of its solid track record and the market’s pessimistic view of future performance. PG’s current stock price (~$61.55) implies that profits will permanently decline by 10%. These are low expectations for such a consistent cash flow generator.
Rydex Series Funds: Real Estate Fund (RYREX) is my worst Financials mutual fund. It earns my Very Dangerous rating by allocating over 85% of its value to Dangerous-or-worse-rated stocks, and to make matters worse, charges investors annual costs of 8.39%.
Ventas Inc. (VTR) is one of my least favorite stocks held RYREX. It earns my Very Dangerous rating because of misleading earnings and an expensive valuation. VTR has failed to earn a return on invested capital (ROIC) sufficient enough to cover its weighted average cost of capital (WACC) three of the past four years. Its current valuation implies the company will grow profits (NOPAT) at over 40% compounded annually for the next 10 years. Hard to see how the stock could do anything but go down from there.
Figure 2 shows the distribution of our Predictive Ratings for all sector ETFs and mutual funds.
Figure 2: Distribution of ETFs & Mutual Funds (Assets and Count) by Predictive Rating 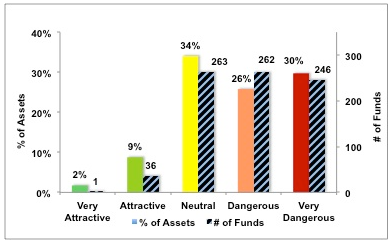
Source: New Constructs, LLC and company filings
Figure 3 offers additional details on the quality of the sector funds. Note that the average Total Annual Cost of Very Dangerous funds is almost 6 times that of Very Attractive funds.
Figure 3: Predictive Rating Distribution Stats
* Avg TAC = Weighted Average Total Annual Costs
Source: New Constructs, LLC and company filings
This table shows that only the best of the best funds get our Very Attractive Rating: they must hold good stocks AND have low costs. Investors deserve to have the best of both and we are here to give it to them.
Ratings by Sector
Figure 4 presents a mapping of Very Attractive funds by sector. The chart shows the number of Very Attractive funds in each sector and the percentage of assets allocated to Very Attractive-rated funds in each sector.
Only one sector fund earns my Very Attractive rating.
Figure 4: Very Attractive ETFs & Mutual Funds by Sector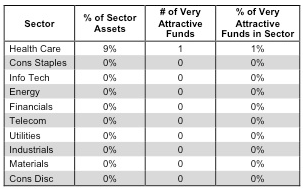
Source: New Constructs, LLC and company filings
Figure 5 presents the data charted in Figure 4
Figure 5: Very Attractive ETFs and Mutual Funds by Sector 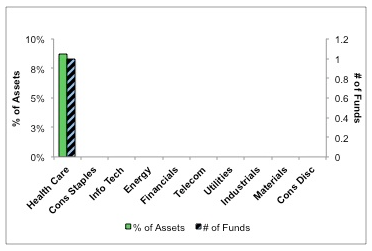
Source: New Constructs, LLC and company filings
Figure 6 presents a mapping of Attractive funds by sector. The chart shows the number of Attractive funds in each sector and the percentage of assets allocated to Attractive-rated funds in each sector.
Note that only the Consumer Staples, Information Technology, Health Care and Energy sectors house Attractive-rated funds. No other sectors house ETFs or mutual funds worthy of investment.
Figure 6: Attractive ETFs and Mutual Funds by Sector 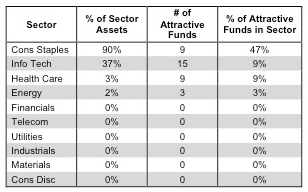
Source: New Constructs, LLC and company filings
Figure 7 presents the data charted in Figure 6.
Figure 7: Attractive ETFs & Mutual Funds by Sector 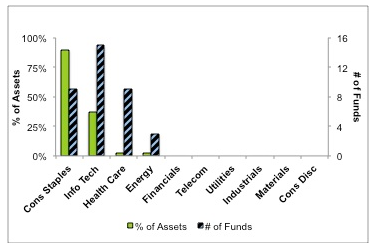
Source: New Constructs, LLC and company filings
Figure 8 presents a mapping of Neutral funds by sector. The chart shows the number of Neutral funds in each sector and the percentage of assets allocated to Neutral-rated funds in each sector.
Figure 8: Neutral ETFs & Mutual Funds by Sector 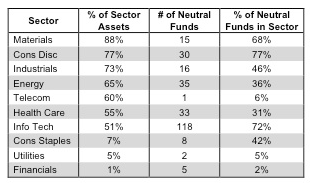
Source: New Constructs, LLC and company filings
Figure 9 presents the data charted in Figure 8.
Figure 9: Neutral ETFs and Mutual Funds by Sector 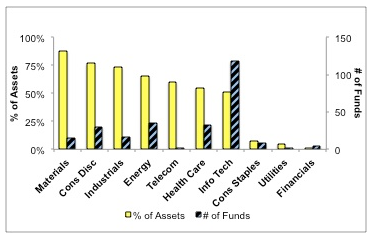
Source: New Constructs, LLC and company filings
Figure 10 presents a mapping of Dangerous funds by fund sector. The chart shows the number of Dangerous funds in each sector and the percentage of assets allocated to Dangerous-rated funds in each sector.
The Utilities, Energy, Telecom, Health Care, and Industrials house at least 25% of their value in Dangerous-rated funds.
Figure 10: Dangerous ETFs and Mutual Funds by Sector 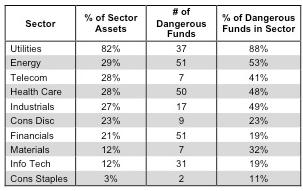
Source: New Constructs, LLC and company filings
Figure 11 presents the data charted in Figure 10.
Figure 11: Dangerous ETFs and Mutual Funds by Sector 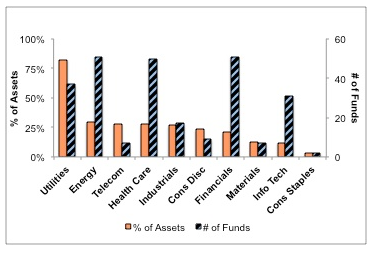
Source: New Constructs, LLC and company filings
Figure 12 presents a mapping of Very Dangerous funds by fund sector. The chart shows the number of Very Dangerous funds in each sector and the percentage of assets allocated to Very Dangerous-rated funds in each sector.
Figure 12: Very Dangerous ETFs and Mutual Funds by Sector 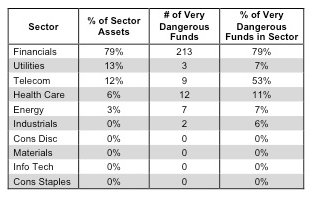
Source: New Constructs, LLC and company filings
Figure 13 presents the data charted in Figure 12.
Figure 13: Very Dangerous ETFs and Mutual Funds by Sector 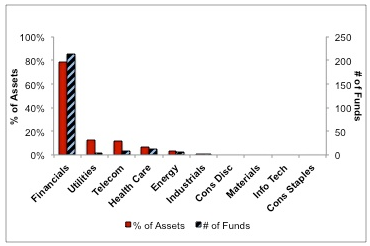
Source: New Constructs, LLC and company filings
- English (UK)
- English (India)
- English (Canada)
- English (Australia)
- English (South Africa)
- English (Philippines)
- English (Nigeria)
- Deutsch
- Español (España)
- Español (México)
- Français
- Italiano
- Nederlands
- Português (Portugal)
- Polski
- Português (Brasil)
- Русский
- Türkçe
- العربية
- Ελληνικά
- Svenska
- Suomi
- עברית
- 日本語
- 한국어
- 简体中文
- 繁體中文
- Bahasa Indonesia
- Bahasa Melayu
- ไทย
- Tiếng Việt
- हिंदी
Roadmap To The Best And Worst ETF And Mutual Fund Sectors
Published 07/11/2012, 06:38 AM
Updated 07/09/2023, 06:31 AM
Roadmap To The Best And Worst ETF And Mutual Fund Sectors
Latest comments
Loading next article…
Install Our App
Risk Disclosure: Trading in financial instruments and/or cryptocurrencies involves high risks including the risk of losing some, or all, of your investment amount, and may not be suitable for all investors. Prices of cryptocurrencies are extremely volatile and may be affected by external factors such as financial, regulatory or political events. Trading on margin increases the financial risks.
Before deciding to trade in financial instrument or cryptocurrencies you should be fully informed of the risks and costs associated with trading the financial markets, carefully consider your investment objectives, level of experience, and risk appetite, and seek professional advice where needed.
Fusion Media would like to remind you that the data contained in this website is not necessarily real-time nor accurate. The data and prices on the website are not necessarily provided by any market or exchange, but may be provided by market makers, and so prices may not be accurate and may differ from the actual price at any given market, meaning prices are indicative and not appropriate for trading purposes. Fusion Media and any provider of the data contained in this website will not accept liability for any loss or damage as a result of your trading, or your reliance on the information contained within this website.
It is prohibited to use, store, reproduce, display, modify, transmit or distribute the data contained in this website without the explicit prior written permission of Fusion Media and/or the data provider. All intellectual property rights are reserved by the providers and/or the exchange providing the data contained in this website.
Fusion Media may be compensated by the advertisers that appear on the website, based on your interaction with the advertisements or advertisers.
© 2007-2024 - Fusion Media Limited. All Rights Reserved.
