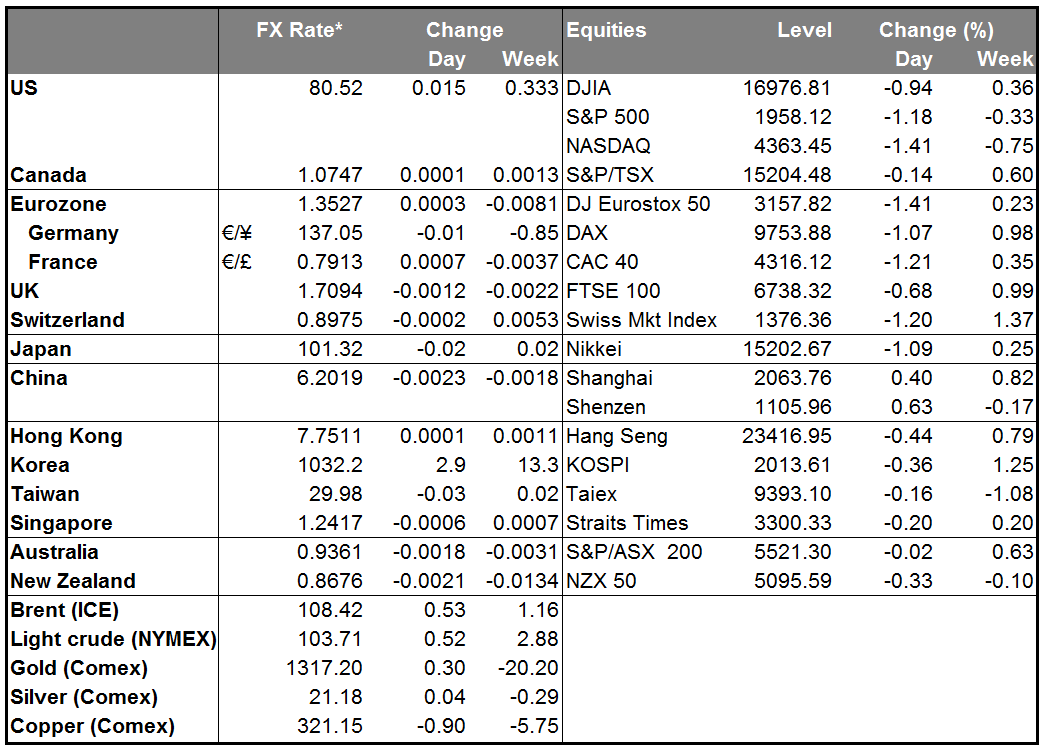
I said yesterday morning that the “risk-on, risk-off” paradigm had ended, but events later in the day showed that I was premature -- it hasn’t disappeared yet by any means if there are events of great enough significance to move all the markets. The crash of a Malaysia Airlines plane in eastern Ukraine late yesterday was indeed such an event, as it increases the tensions between Russia and the West that were already heightened by the imposition of new sanctions on Russia just a short while before. Safe-haven assets such as the yen, Swiss franc, gold and Treasury bonds and Bunds gained, while stock markets were generally lower (although Asian markets are mixed this morning) and industrial metals fell. Fed Fund futures expectations for mid-2017 were off 5.5 bps. The increased tensions with Russia also sent oil prices higher.
Yesterday’s actions reveal an important point: the dollar is still the safe-haven currency. The US unit gained against all the other G10 currencies except for the yen, plus most EM currencies. RUB was of course the hardest-hit currency, but BRL, MXN and several of the other Eastern European currencies had significant falls as well, perhaps as investors took off carry trades. EUR kept stable vs USD EUR/USD, which I would attribute to the other side of these carry trade unwinds – perhaps EUR is being used as the funding currency. The safe-haven flows countered the USD-negative impact of disappointing housing starts and permits figures for June.
I expect the Ukraine situation to dominate trading today. The UN Security Council will meet today to discuss Ukraine and investors will want to see what the conclusion of that meeting is. So far, events in Ukraine have not had that much lasting impact on the markets and the fact that Asian stock markets are mixed this morning and gold off its highs suggests that the tension is already fading. There could be some reversal in the trades that we saw put on yesterday, which would suggest lower gold and oil in particular.
On other matters, St. Louis Fed President Bullard said that if the economy continues to grow at its current pace, the Fed may have to raise rates "sooner rather than later." This is similar to what Fed Chair Janet Yellen said when she remarked on Tuesday that if the labor market continues to improve at its current pace, “then increases in the federal funds rate target likely would occur sooner and be more rapid than currently envisioned.” Bullard’s views are important because he has not been consistently dovish or hawkish, and therefore he is taken as an indication of where the median of the FOMC is headed. I agree with his view and expect that so long as the US economy does continue to recover at its current pace, the normalization of interest rates is likely to start earlier than the market expects and therefore the dollar is likely to strengthen.
Is inflation finally coming to Japan for real? The monthly revised wages data out today showed that average wages were revised down to +0.6% yoy from a preliminary +0.8%. Not great, but still the third consecutive yoy rise. And base wages were revised down to unchanged yoy from +0.2%, again not great but better than the previous 23 consecutive months of yoy declines. To see real inflation, Japan needs not only higher prices but also higher wages. This may be a modest start in that direction.
Today: During the European day, the only indicator we get is the single currency bloc’s current account for May. The region’s large current account surplus is one reason for the strong EUR, although the report tends not to be market-moving.
In Canada, the headline and core CPI for June are estimated to have remained unchanged at +2.3% yoy and +1.7% yoy respectively. In the statement released after the Bank of Canada latest policy decision on Wednesday, the Bank attributed the recent higher inflation to temporary effects rather than to any change in economic fundamentals. They predicted inflation would “fluctuate around 2%” for the next two years, which implies that they have no need to tighten policy during that time. With this in mind, Friday’s CPI for Canada will most likely not be a major market-affecting event.
From the US, we get the preliminary U of Michigan consumer confidence sentiment for July. The market expects it to increase slightly. The Conference Board leading index for June is also coming out and the forecast is for the pace to remain unchanged.
We have only one speaker on Friday’s agenda, ECB Governing council member Jens Weidmann speaks in Madrid.
The Market
EUR/USD remains slightly above 1.3500
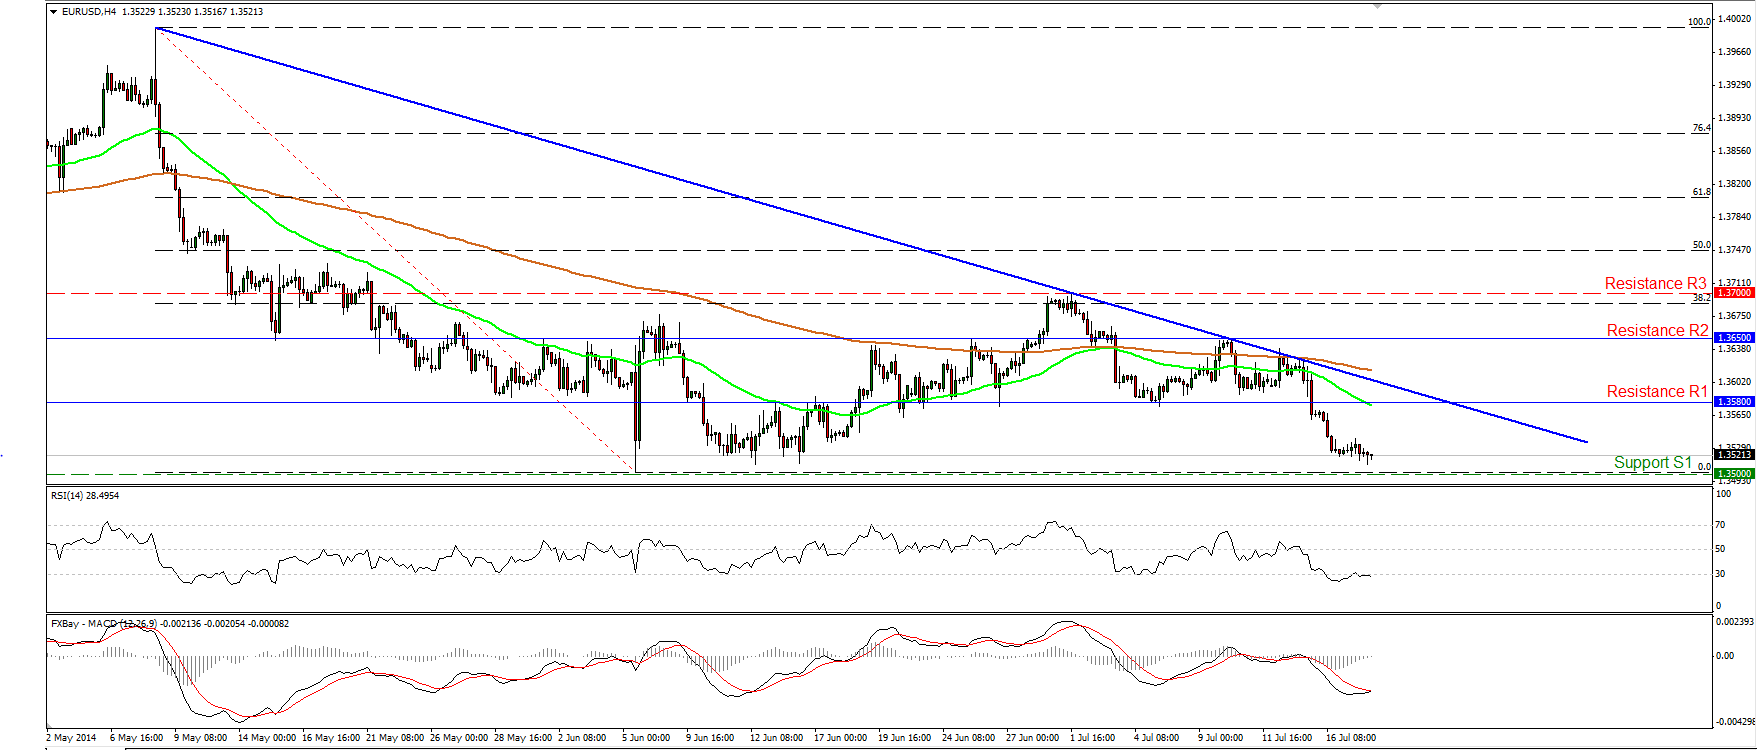
EUR/USD moved in a consolidative mode on Thursday, remaining slightly above the key 1.3500 (S1) barrier. I still expect the rate to challenge that psychological zone. The RSI lies within its oversold field, testing its 30 level, while the MACD shows signs of bottoming and seems ready to move above its signal line. Taking this into account, it’s possible that EUR/USD could consolidate or even bounce slightly before the bears show their teeth again. On the daily chart, the 50-day moving average is getting even closer to the 200-day moving average. A bearish cross in the near future would be an additional negative sign. My opinion is that we should wait to see if the sellers are strong enough to overcome the 1.3500-1.3475 zone before expecting larger bearish extensions in the future.
• Support: 1.3500 (S1), 1.3475 (S2), 1.3400 (S3)
• Resistance: 1.3580 (R1), 1.3650 (R2), 1.3700 (R3)
USD/JPY touches 101.10 and rebounds
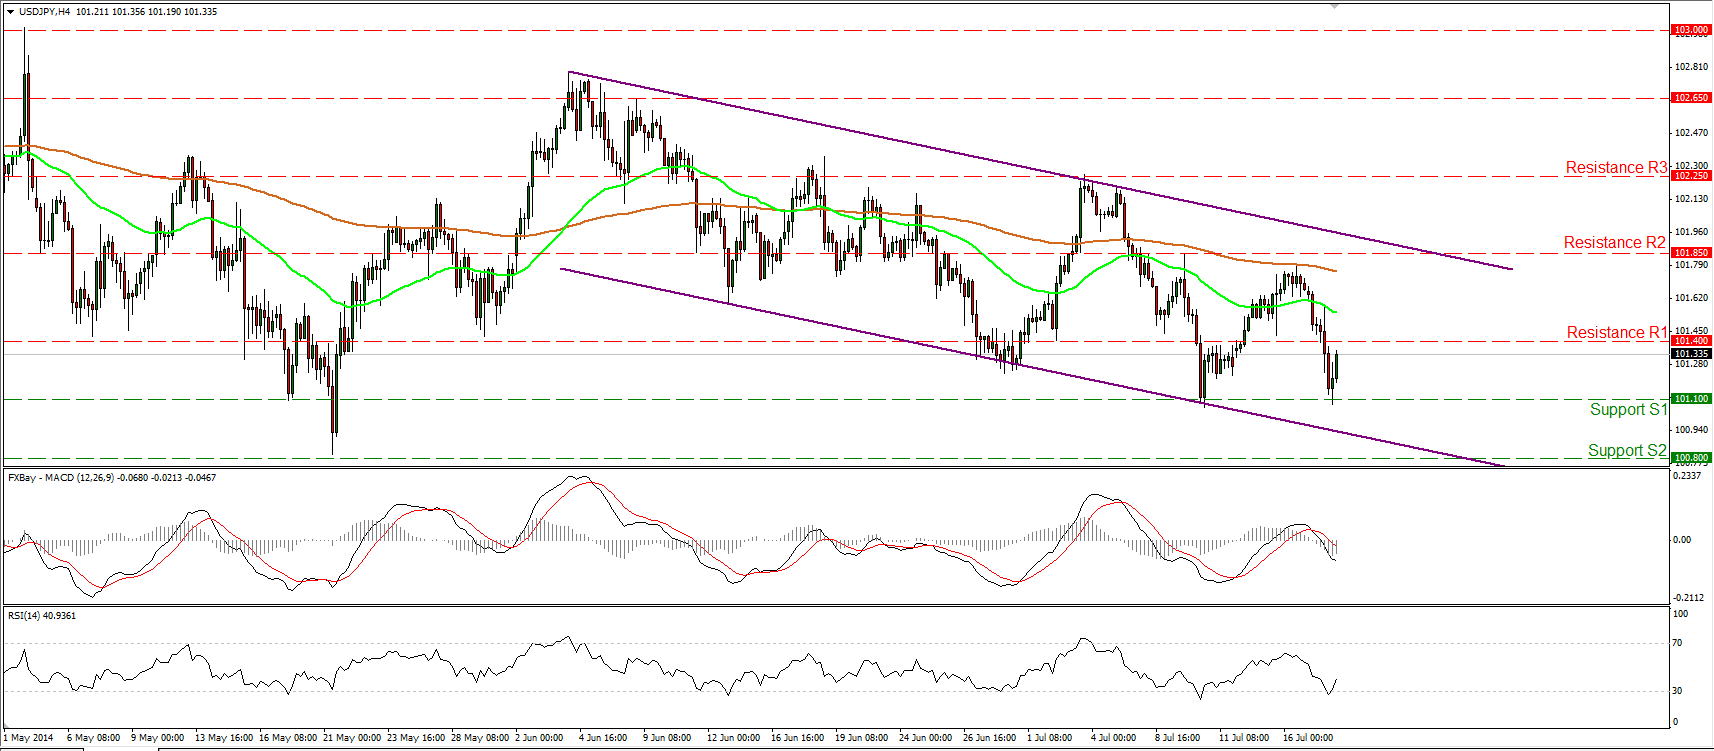
USD/JPY tumbled yesterday, breaking below the 101.40 (support turned into resistance), and reached our next barrier at 101.10 (S1). Nevertheless, the rate triggered some buy orders below that barrier, rebounded and at the time of writing, is heading back towards the 101.40 (R1) barrier to challenge it as a resistance this time. A decisive violation of that bar is likely to see scope for another test near the 101.80/85 (R2) zone. The pair is trading within the purple downside channel though and as a result, I would consider the overall short-term path to remain to the downside and any advances within the channel as corrective waves.
• Support: 101.10 (S1), 100.80 (S2), 100.40 (S3)
• Resistance: 101.40 (R1), 101.85 (R2), 102.25 (R3)
IS EUR/GBP ready to retrace?
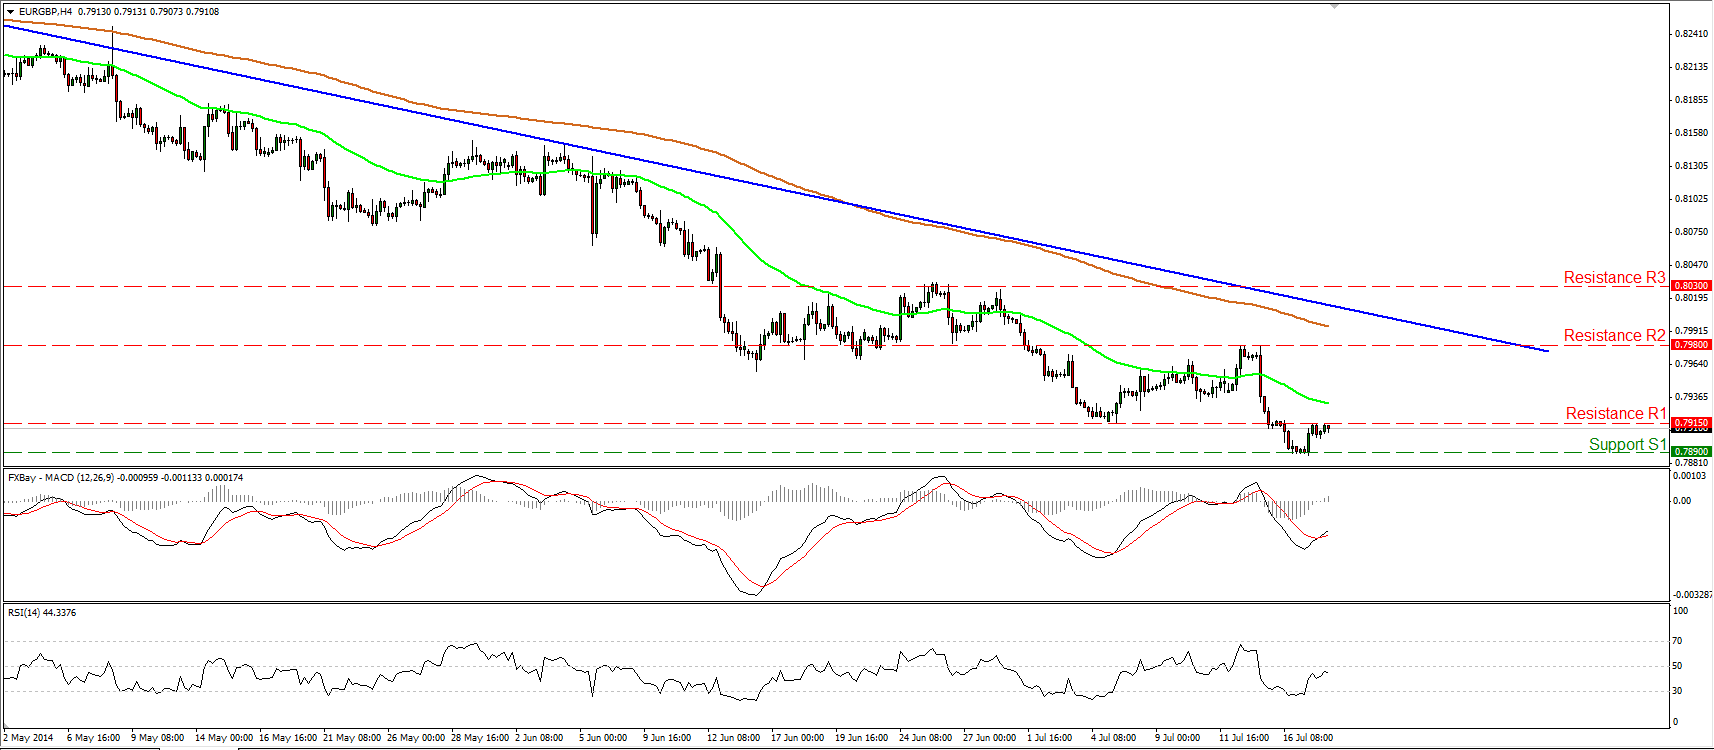
EUR/GBP moved marginally higher after finding support at 0.7890 (S1) and is currently testing the 0.7915 (R1) as a resistance. A clear violation above that level could signal the continuation of the rebound and trigger extensions towards the 0.7980 (R2) zone or near the blue downtrend line. Moreover, on the daily chart I can see positive divergence between our daily momentum studies and the price action, magnifying the case for an upside corrective wave in the near future. Nonetheless, as long as the pair is trading below the blue downtrend line drawn from back the 11th of April, I see a negative overall outlook and I would take a possible continuation of the rebound as a retracement.
• Support: 0.7890 (S1), 0.7830 (S2), 0.7760 (S3)
• Resistance: 0.7915 (R1), 0.7980 (R2), 0.8030 (R3)
Gold surges and touches 1325
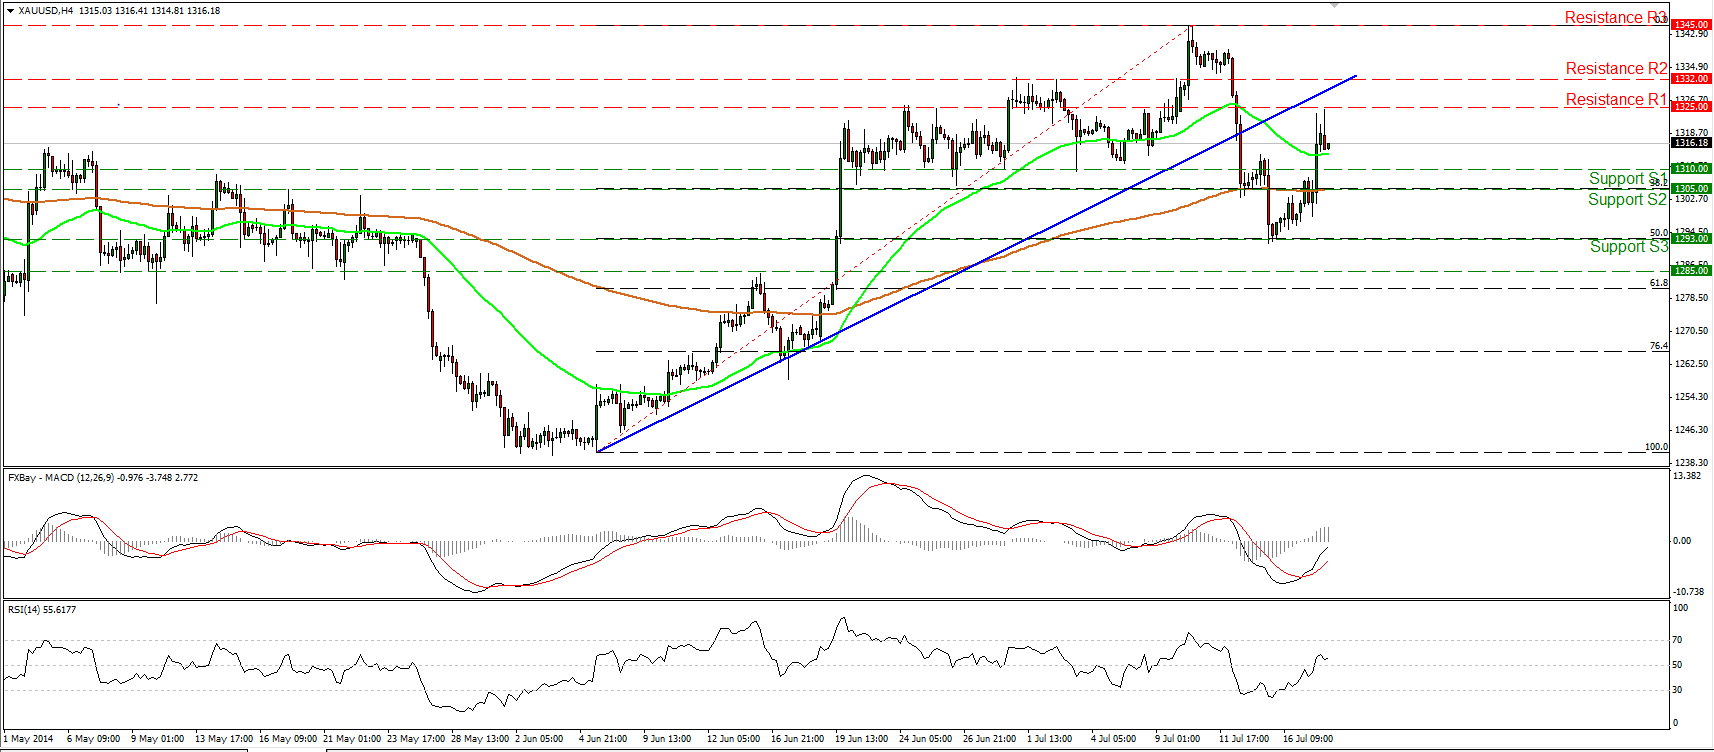
Gold emerged above the resistance zone (turned into support) of 1305/10 and reached the next area of 1325 (R1). This could be a first sign that the recent plunge was just a 50% retracement level of the 5th June – 10th of July up move. Despite the strong rally, I would keep my neutral stance since the precious metal has to deal with the prior uptrend line and the zone of 1325/32, where it may find strong resistance. On the downside, only a move below 1293 (S3) could confirm a forthcoming lower low and flip the picture negative.
• Support: 1310 (S1), 1305 (S2), 1293 (S3)
• Resistance: 1325 (R1), 1332 (R2), 1345 (R3)
WTI climbs above 103.00
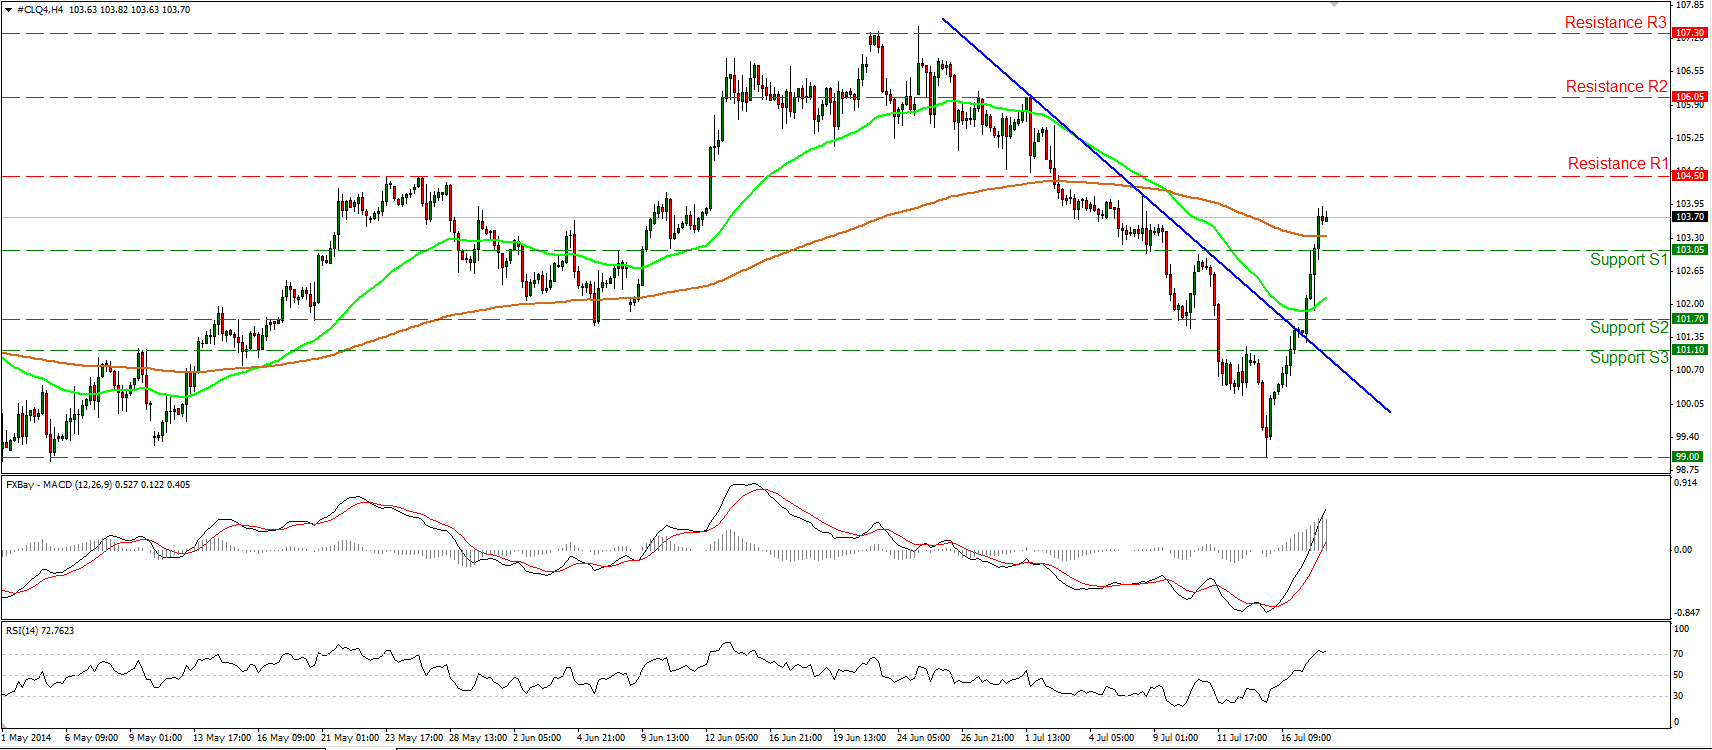
WTI rallied yesterday, breaking above the blue downtrend line and crushing two resistance barriers in a row. The price moved above 101.70 (S2), reached the 103.05 (S1) barrier and after some profit taking near that zone (shown on the 1-hour chart) the bulls regained momentum and drove the battle above the 103.05 hurdle. The picture is now turned positive, in my view, and I expect WTI to challenge the resistance of 104.50 (R1). A clear break of that level could trigger further bullish extensions towards the next obstacle at 106.05 (R2). The MACD turned positive, while the RSI moved above 70, indicating the accelerating bullish momentum. However, zooming on the 1-hour chart, the 14-hour RSI seems ready to exit overbought conditions, while the hourly MACD shows signs of topping and seems ready to move below its signal line. Bearing that in mind, I cannot rule out a pullback before the longs prevail again.
• Support: 103.05 (S1), 101.70 (S2), 101.10 (S3)
• Resistance: 104.50 (R1), 106.05 (R2), 107.30 (R3)

