Casual dining restaurant operator Red Robin Gourmet Burgers (NASDAQ:RRGB) stock has surged over 80% hitting all target trajectories since our Aug. 2, 2020 article. It’s time to ring the register to trim profits as the “bargain” has become fully priced.
While fundamental have improved with the economic restarts coupled with the approaching COVID-19 vaccine FDA approvals on the horizon, the reemergence of a third wave of COVID also looks to undermine further recovery notable in dine-in locations as capacity limits and rollbacks get reinstated. The market may be hastily putting the pandemic in the rearview mirror. Prudent investors can use the frothiness to wind down exposure from a position of strength at opportunistic exit levels as the benchmark S&P 500 index still remains near all-time highs.
Q3 FY 2020 Earnings Release
On Nov. 5, 2020, Red Robin released its third-quarter fiscal 2020 results for the quarter ending September 2020. The Company reported an earnings-per-share (EPS) loss of (-$0.19) excluding non-recurring items versus consensus analyst estimates for a loss of (-$1.57), beating estimates by $1.37. Revenues fell (-31.8%) year-over-year (YoY) to $200.50 million versus $206.20 million consensus analyst estimates. Comparable same-store-sales fell (-25.1%) YoY. Guest count fell (-24.6%) YoY and (-0.5%) decrease in average guest check driven by (-3.6%) in menu mix offset by 2.2% increase in pricing.
Conference Call Takeaways
Red Robin CEO, Paul Murphy, addressed the steps to bolster seating capacity:
“The main driver of this progress is the increase in sit down capacity both outdoors and in our dining rooms. Partitions are also currently being installed in all of our dining rooms to safely optimize and expand indoor seating enabling us to achieve approximately 70% capacity as we enter the colder weather.”
The Company has resumed implementation of Donatos by training teams to prepare the pizza for 31 locations in the Pacific Northwest, which the Company already purchased the equipment. This brings a total 79 stores that offer Donators Pizza. Red Robin ended the quarter with approximately $97.1 million including $27 million of cash and cash equivalents, excluding the recent $49.4 million IRS tax refund. The Company plans to defer $12 million to $18 million of payroll taxes to be repaid in late 2021 to 2022 and expects an additional $12 million to $15 million in cash tax refunds from the net operating loss carryback in 2021.
Vulnerabilities
Red Robin has not been recovering as quickly as other restaurant stocks. The onset for dining room capacity limits being reinstated for many states is troubling for the company, especially heading into winter weather conditions. The strength of its recovery hinged on the Company owned restaurants with indoor dining rooms, which improved to (-16.1%) of YoY sales for September 2020, compared to (-21.9%) drop in overall Company-owned restaurants. Dine-in sales were down (-49.7%) YoY.
The Company plans to expand outdoor dining accommodative to COVID-19 safeguards starting in California, but this will be costly and add to the cash burn. It will only be applicable to restaurants that still have warmer weather, compared to those in the Northeast with frigid winter weather conditions. Q3’s reopening cash burn sits at $3 million per week, which is troubling considering the Company has $103 million in total liquidity. This is after the $30 million at-the-market (ATM) secondary offering announced June 17, 2020.
The problem is Red Robin’s business was already compressing ahead of COVID-19. The initiative to expand menu offerings with Donatos Pizza appears to have stagnated. Debt remains at more than double the liquidity. The tiny 15.5 million share float with a 35% short interest (as of Oct. 29, 2020) is keeping shares buoyant for now. Prudent investors should look to trim down into opportunistic exit levels while the momentum is still strong.

RRGB Opportunistic Exit Levels
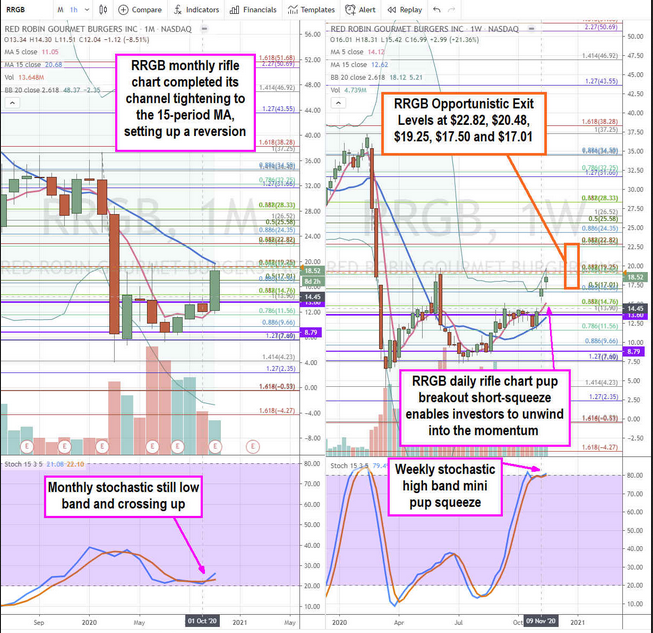
Using the rifle charts on the monthly and weekly time frames provides a broader view of the landscape for RRGB stock. The monthly rifle chart is completing its channel tightening as the stochastic crossover up off the 20-band continued to drive momentum.
The weekly stochastic has a high band mini pup trying to squeeze through the 80-band. The weekly rifle chart has a pup breakout with expanding daily upper Bollinger Bands (BBs) pointing at $19.58. RRGB stock is in a perfect storm breakout largely fueled by a short-squeeze of the tiny 15.5 million share float of which 35% was short as of Oct. 29, 2020.
This can provide the liquidity for prudent investors to unwind into opportunistic exit price levels ranging from the $17.01 Fibonacci (fib) level, $17.50, $19.25 fib, $20.48 monthly 15-period MA and $22.82 fib. Profits should be taken on the rise through each price level with a profit trail stop below the lowest price level of $17.01.
