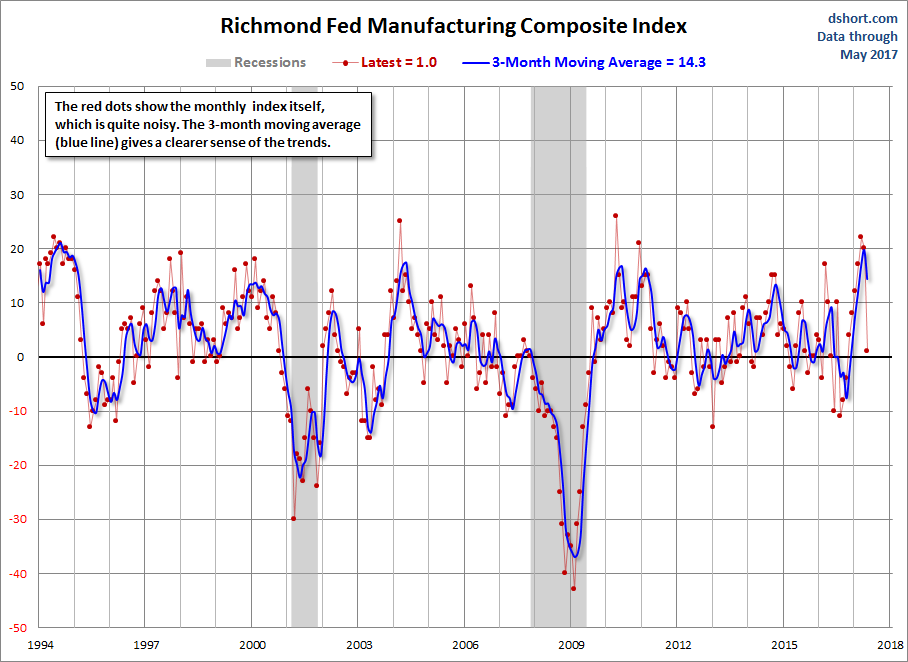
Today the Richmond Fed Manufacturing Composite Index plunged 19 points to 1from last month's 20. Investing.com had forecast 15. Because of the highly volatile nature of this index, we include a 3-month moving average to facilitate the identification of trends, now at 14.3, which indicates expansion. The complete data series behind today's Richmond Fed manufacturing report, which dates from November 1993, is available here.
Here is a snapshot of the complete Richmond Fed Manufacturing Composite series.
Here is the latest Richmond Fed manufacturing overview.
Manufacturers in the Fifth District were somewhat less upbeat in May than in the prior three months, according to the latest survey by the Federal Reserve Bank of Richmond. The index for shipments and the index for new orders decreased notably, with the shipments index falling to slightly below 0. The index for employment was relatively flat, but the decline in the other two indexes resulted in a decline in the composite index from 20 in April to 1 in May. The majority of firms continued to report higher wages, but more firms reported a decline in the average workweek than reported an increase.
Looking six months ahead, manufacturing executives remained generally optimistic, although the only index to increase was expected capital expenditures. Nonetheless, the expected shipments index had a strong reading of 39 in May (from 42 in April) and the expected new orders index remained relatively high at a reading of 35.
Survey respondents reported that growth in both prices paid and prices received moderated somewhat. Link to Report
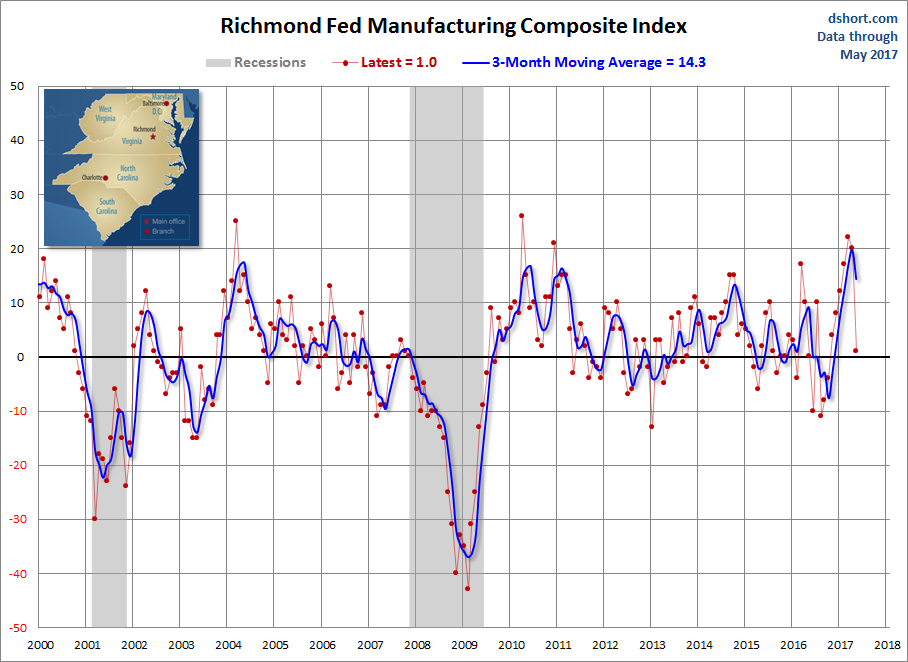
Here is a somewhat closer look at the index since the turn of the century.
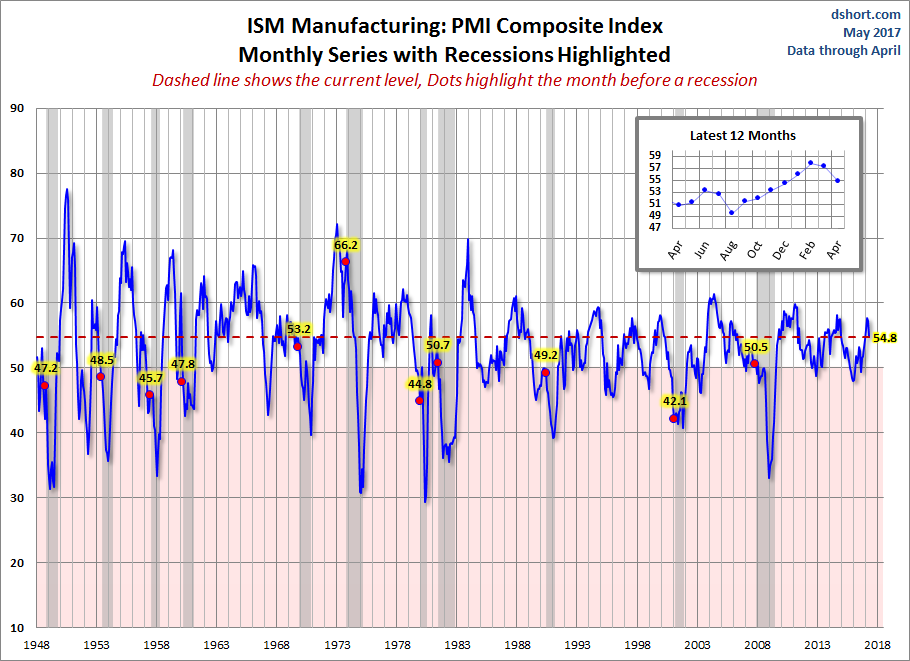
Is today's Richmond composite a clue of what to expect in the next PMI composite? We'll find out when the next ISM Manufacturing survey is released (below).
Because of the high volatility of this series, we should take the data for any individual month with the proverbial grain of salt.
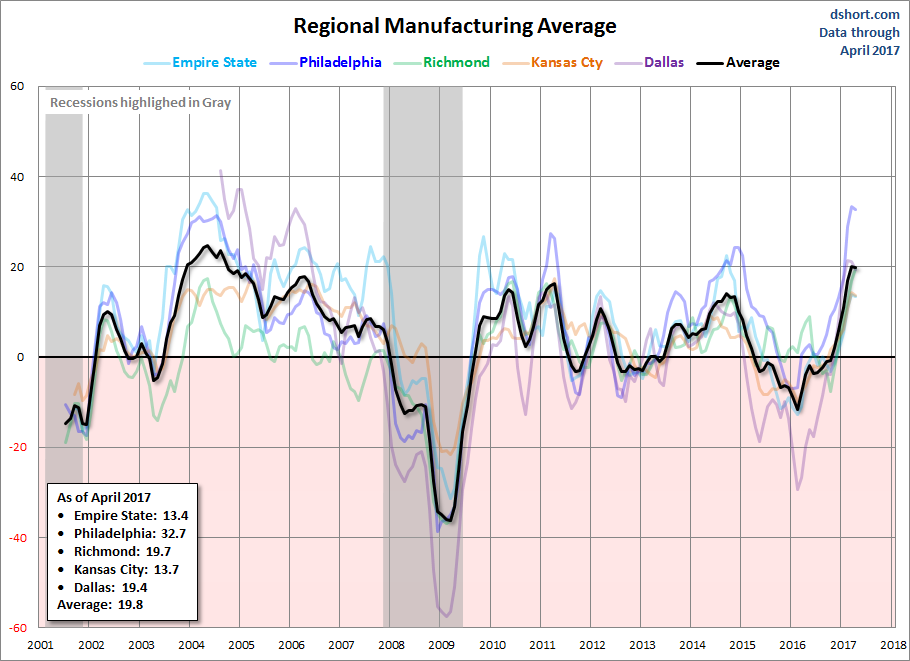
Let's compare all five Regional Manufacturing indicators. Here is a three-month moving average overlay of each since 2001 (for those with data).
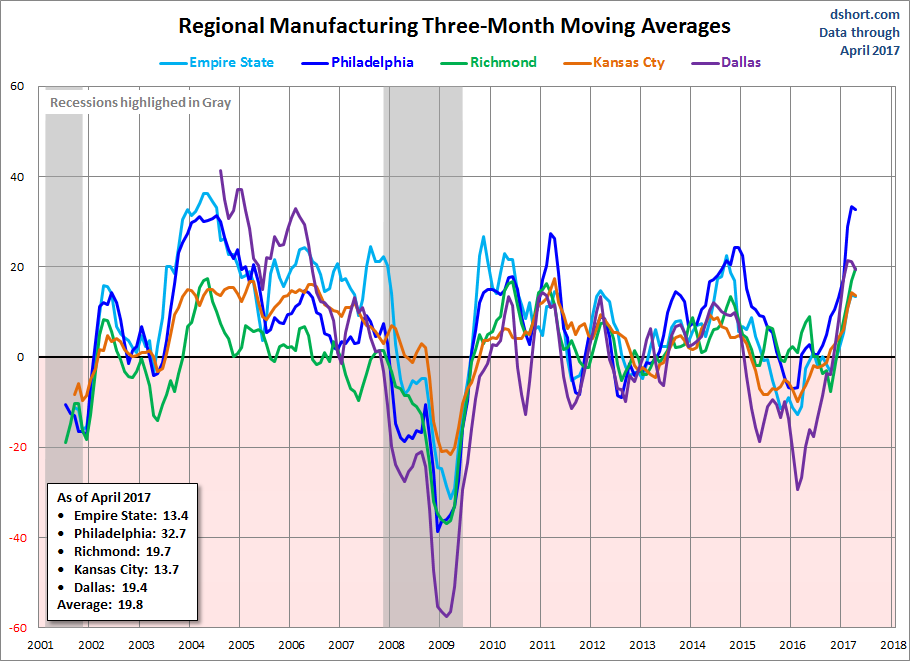
Here is the same chart including the average of the five.