Back in late March, I thought the Muni market was setting up for a pullback. It took its time to correct, but did touch the 104.30 target on the way to Monday’s low at 100.28 - quite a bit further than the expectation. With a more than parabolic fall, a Baumgartner fall, it is looking like the time to buy the crash. There are 6 reasons why in the daily chart. The Relative Strength Index (RSI) is under 13. It has been this low only once, just before the start of the run higher in December 2010. 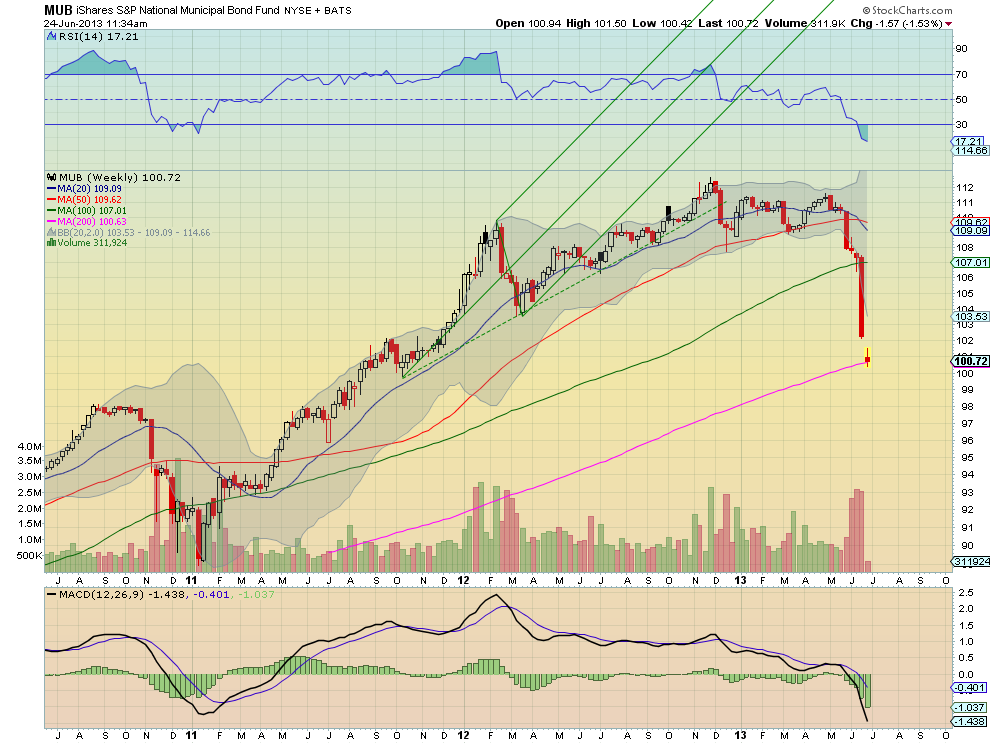
The Moving Average Convergence Divergence indicator (MACD) is at historic lows. Both of these may go lower, but I have an idea for that. Next - the price is more than 10% from its 50 day Simple Moving Average (SMA). It is also far outside of the lower Bollinger band®. The volume is also spiking. The Spinning Top candle is finally showing indecision, often a reversal signal. If you need more convincing, the RSI on the weekly chart is also in the teens and at all time lows, as the price sits on the 200 week SMA with the MACD at extremes as well. You may notice that the previous low in the RSI did not mark the bottom, but was very close. If this is a concern, then you can start your position by selling the July 99 Puts for the first 1/3 of your position. These were offered at about $2.05 when I traded them at 2:00pm Monday. 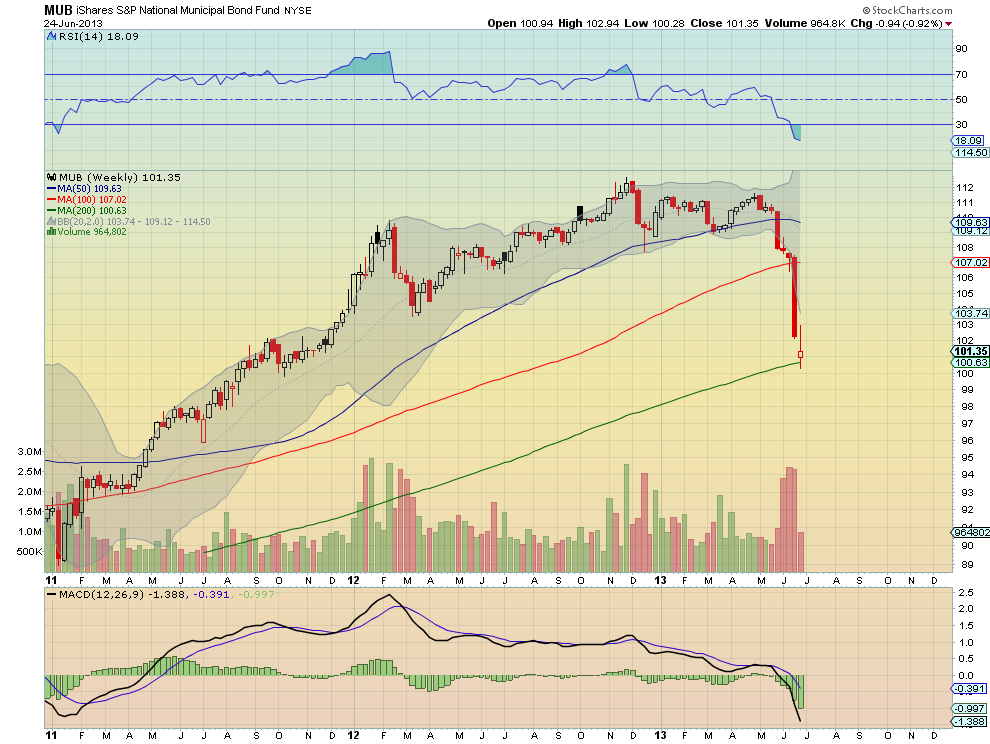
The information in this blog post represents my own opinions and does not contain a recommendation for any particular security or investment. I or my affiliates may hold positions or other interests in securities mentioned in the Blog, please see my Disclaimer page for my full disclaimer.
Original post
- English (UK)
- English (India)
- English (Canada)
- English (Australia)
- English (South Africa)
- English (Philippines)
- English (Nigeria)
- Deutsch
- Español (España)
- Español (México)
- Français
- Italiano
- Nederlands
- Português (Portugal)
- Polski
- Português (Brasil)
- Русский
- Türkçe
- العربية
- Ελληνικά
- Svenska
- Suomi
- עברית
- 日本語
- 한국어
- 简体中文
- 繁體中文
- Bahasa Indonesia
- Bahasa Melayu
- ไทย
- Tiếng Việt
- हिंदी
Revisiting The Muni Market
Published 06/24/2013, 12:35 AM
Updated 05/14/2017, 06:45 AM
Revisiting The Muni Market
Latest comments
Loading next article…
Install Our App
Risk Disclosure: Trading in financial instruments and/or cryptocurrencies involves high risks including the risk of losing some, or all, of your investment amount, and may not be suitable for all investors. Prices of cryptocurrencies are extremely volatile and may be affected by external factors such as financial, regulatory or political events. Trading on margin increases the financial risks.
Before deciding to trade in financial instrument or cryptocurrencies you should be fully informed of the risks and costs associated with trading the financial markets, carefully consider your investment objectives, level of experience, and risk appetite, and seek professional advice where needed.
Fusion Media would like to remind you that the data contained in this website is not necessarily real-time nor accurate. The data and prices on the website are not necessarily provided by any market or exchange, but may be provided by market makers, and so prices may not be accurate and may differ from the actual price at any given market, meaning prices are indicative and not appropriate for trading purposes. Fusion Media and any provider of the data contained in this website will not accept liability for any loss or damage as a result of your trading, or your reliance on the information contained within this website.
It is prohibited to use, store, reproduce, display, modify, transmit or distribute the data contained in this website without the explicit prior written permission of Fusion Media and/or the data provider. All intellectual property rights are reserved by the providers and/or the exchange providing the data contained in this website.
Fusion Media may be compensated by the advertisers that appear on the website, based on your interaction with the advertisements or advertisers.
© 2007-2024 - Fusion Media Limited. All Rights Reserved.