The old American idiom of a day late and dollar short, an phrase easily applied to the majority that drives trends, describes the instinctual behavior tendency of the individual to seek acceptance of the crowd; this innate drive is so strong, most investors sacrifice performance to stand with them.
The majority, driven by instincts and emotions rather than logic, reasoning, and computer analysis, views rising and falling stocks prices as bullish and bearish. This often drives them to chase when the message of the market recommends fading. The consistency of human behavior makes the majority the consistent bagholders of history's panics.
Investors study sentiment in order to fade the intentions of the majority and improve market timing. Timing is as easy as 1-2-3.
Summary
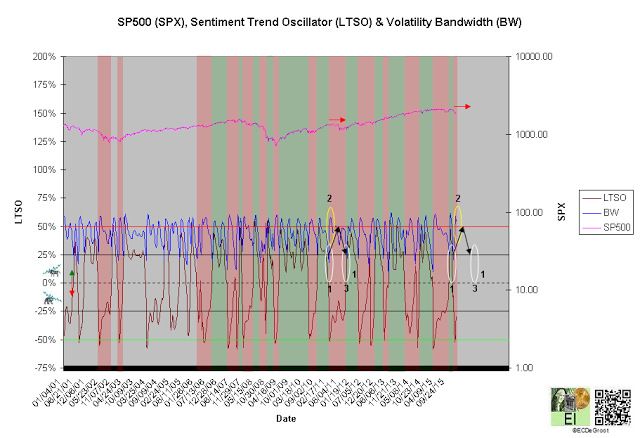
The sentiment oscillator (LTSO) defines a bear phase (red box) since the third week of December (see trend). The bear phase, a trend that generally leads US stock prices and supports the bears, could push pessimism to extreme levels (see concentration)..
Interactive Charts: N:SPY, SPY PF
Review of SP500, Charts Review of S&P 500
Bull%
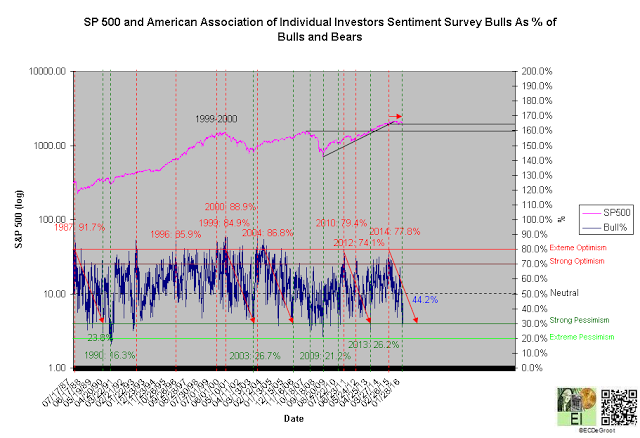
Concentrated optimism and pessimism, defined by Bull% closes above and below 70% and 30%, trigger sell and buy signals for stocks (chart 1).
Bull% upticked to 44.2% from 28.2% on the second week in January. While most intermediate- to long-term bottoms record Bull% readings from 30% to 20%, they occasionally include panic selling (capitulation) that pushes Bull% below 20%. These examples of extreme pessimism have been observed only twice (1990 and 1991) since 1987.
Rising optimism from the 07/30 low defined a countertrend rally, while increasing pessimism (falling optimism) from the 11/05 high defines continuation of cause building.
Chart 1
Trend
A negative long-term sentiment oscillator (LTSO) defines expansion and bear phase (red box) since the third week of December (chart 2). Expansion, a component of the CEC cycle, is important to timing (see below). The bears control the trend until reversed by a bullish crossover. Compression (white circles) generally anticipates this change.
Bulls buying 'buying the dip' are early according the CEC cycle. While a bearish crossover tightened risk management for the bulls and loosen it for the bears on the third week of December at 2073.07 (SPY), the compression (1) that followed from 2064.29 to 2063.36 over the next two trading weeks amplified the signal. Expansion (2) marks the mid point of the CEC cycle on the fourth week of January. Expansion is followed by compression (3). Bulls buying the dip in stocks, the mid point of the CEC cycle or expansion, are early. Early buying, regardless of the catchy name, can lead to losses and frustration that the rally is taking too long to develop.
Chart 2
Concentration
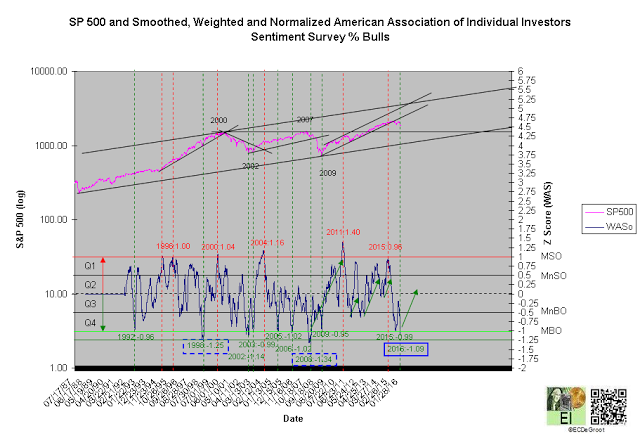
The unwinding of extreme pessimism, an intermediate cycle from fear to greed and transfer of ownership in which the minority (strong hands) fades the actions of the majority (weak hands), continues today (chart 3). This cycle ends when extreme fear generates a minor or major buying opportunity (MnBO or MBO) from 2015 to 2016. WASo can fall below -1.25 during periods of extreme pessimism.
Chart 3


