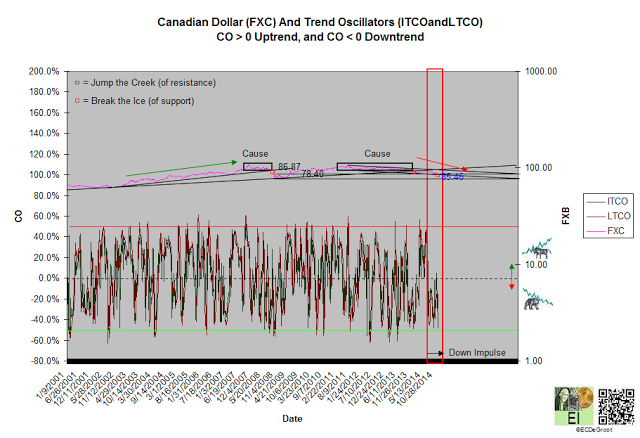
The Canadian dollar (CD) has been confined to mark down phase since February 2014. This phase which has broken the ice of support at 95 and 86.97 has generated one up and two down impulses (chart 1).
The bulls, despite sizable losses from a steady decline, expect CD, oil, and commodities to recover soon. The bears, recognizing the CD's mark down as a byproduct of an expanding global economic contraction (implosion), a steady progression from the periphery to the core, have no trouble shorting this bullish expectation.
The professional investors must profit by anticipating future trends and events rather than chasing old news. This is done by following the invisible hand or message of the market. That message, the simultaneous study of the cycle of accumulation and distribution (trend), the distribution, movement, and participation of leverage (leverage), time/cycles, and human behavior void of opinions is defined below:
CD's (FXC) trend oscillators¹ generated a bearish crossover in August. This crossover triggered a down impulse with targets of 86.97 and 78.4. The recent close below 86.97 should hasten the test of 78.4.
FXC needs to close above 95 to transition the broader trend from mark down to cause. This transition, the accumulation of energy to fuel the change, even if confirmed by capitulation (panic selling) cannot happen overnight. Expectations of a speedy return to mark up (bull market) are unrealistic.
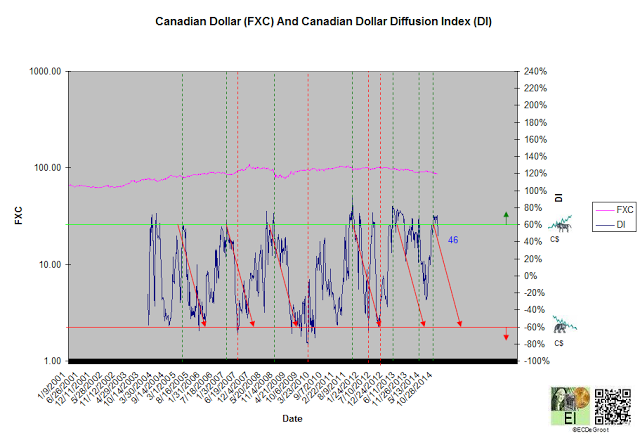
AD's DI reading of 46%, a downtick as price declined suggests distribution². This distribution, originating from extreme positive concentration (bullish setup) that's likely triggered another bull phase³, reflects a weak market (chart 2); this type of distribution has been observed across the commodity sector and commodity-related currencies.
Distribution into strength (rallies) is common to bull phases. Distribution into weakness (declines), a rare observation, suggests an urgency to get out. This cycle inversion increases the probability that the bull phase won't reverse the trend.
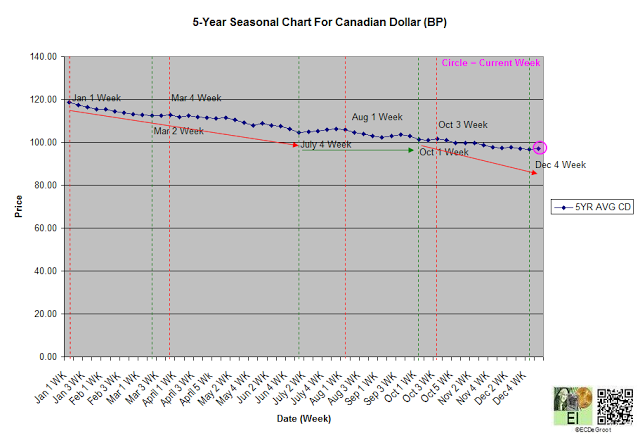
The path of least resistance is down until the third week of March (chart 3). After that, the path of least resistance transitions from down to up until late March. CD's seasonal cycle doesn't turn decisively bullish until July.
Big profits are rarely realized by chasing strength in consolidation during a mark down phase and seasonal weakness.
¹ The intermediate-term close oscillator (ITCO) and long-term close oscillator (LTCO) define a market's trend oscillators and impulse wave. For example, when both trend oscillators are positive and negative, they define up and down impulse waves, respectively. Mix readings, such as a positive ITCO and a negative LTCO, suggest a market transitioning up to down, and vice versa.
² The relationship between DI and price defines accumulation and distribution. Positive (direct) and negative (inverse) relationships as price rallies indicate accumulation and distribution accumulation, respectively. Positive (direct) and negative (inverse) relationships as price declines indicate distribution and accumulation, respectively. In general, bulls purchase accumulation and sell and/or reduce risk into distribution. Bears sell distribution and/or reduce risk into accumulation.
³ Bull and bear phases are defined as positive to negative and negative to positive diffusion index (DI) oscillations.


