A couple of charts to tickle your cerebral cortex.
First, the NYSE market cap divided by the Federal Reserve's Balance Sheet. Next time you're wondering if the Fed can "exit/taper" without an Equity ripple - think about that chart.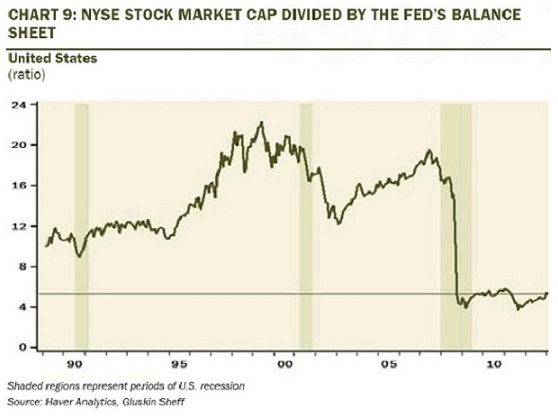
While the S&Ps/RUT closed just shy of new all time highs..... the Fed's balance sheet did hit an all time high today. There is (at least in my mind) a HIGH correlation between Fed purchases and Equity performance.
I see a few things in this chart that goes back to late Reagan/Bush41 times. I'm not making a political argument, but according to whitehouse.gov in inflation adjusted terms the US deficit/surplus goes as follows:
1992: $484 bln deficit
1993: $413 bln deficit
1994: $321 bln deficit
1995: $252 bln deficit
1996: $160 bln deficit
1997: $32 bln deficit
1998: $99 bln SURPLUS (peak equity value v. balance sheet) - Dip following Long Term Capital Management Failure.
We ran surpluses through 2001 when the world (and Strong Dollar policy) was forever altered (9/11).
The ratio weakens as stocks swoon into 2003 and easy monetary policy is used as an analgesic. (January 25, 2003 the Fed cut rates to a then record low 1.00%).
Ratio begins to move higher again in 2003 (equity bottom) as the economy (led by housing) and equities expand. In June of 2003, the Fed started to HIKE rates by 25 basis points every meeting for the next few years. 17 straight meetings with 1/4pt hikes that took Fed Funds from 1% to 5.25% in June 2006.
Until the summer of 2007, when it became apparent that "sub prime was NOT contained" and equity markets topped out.
As I mentioned yesterday, there has been a nearly constant Fed accommodation policy since late 2008 (45 out of 55 months) and the last time the Fed was not active was summer of 2011.
Furthermore, tapering may mean they don't purchase as many Treasuries/MBS (for example, they go from current $85 billion/month back down to a quaint $40 billion - QE3 levels). At some point (probably a LONG time from now) they will have to UNWIND those purchases, correct (depending on duration)? Also, we have to service the interest on the debt (issuing more debt) and at some point there needs to be an unfettered buyer other than the Fed. Or am I missing something?
In September of 2008, the Fed's balance sheet was $900 million. Today, it's $3.35 trillion. It's grown by $2.4 trillion dollars.
Buying less of something is one thing......selling out of it, is quite another. Or, as anybody who has traded for any length of time knows, anyone can get into a position, it's taking it off that is an art.
Moving on to the metals, which have been particularly interesting the past month, it is worth noting that we have not seen unusually high headline inflation numbers during the recovery with the exception of the (Arab) Spring 2011. Keep in mind Core CPI does not include food and energy and Housing values play a large, anchoring role.
A good friend of mine and someone I've relied on for sage advice for many years pointed out the Gold v. S&P spread to me a long time ago. That relationship is back to where it was in fall of 2008 just before Lehman Brothers filed bankruptcy (when the S&Ps were ~1050 and GC at 800). The spread topped out in Feb of 2012 and since that time Gold has dramatically under performed the broad market. 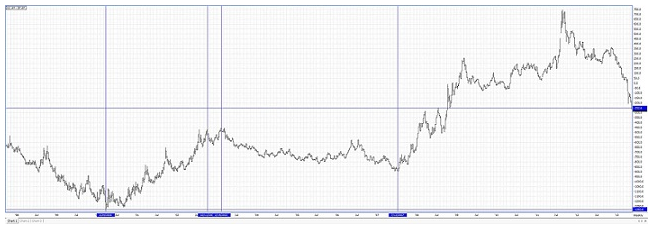
Looking back I see two epochs from a trading perspective - Pre-LEH collapse and post. Perhaps I'm myopic, but I see more similarities to the post LEH world than I do the pre-fall 2008 trade still, but maybe the GC v. SPX spread is telling us this market has more in common with 2007 and before than after. Time will tell.
Just as a frame of reference - this spread made lows in March of 2000 (Nasdaq top). It made highs in February of 2012 (Post LTRO in Europe - VERY aggressive monetary intervention globally). Other pivots include Spring 2003 when stocks bottomed around the time the second Iraq War began. Another bottom in July 2007 when stocks made their (previous) all time highs. A top in March 2009 (equity bottom). Look at the chart and see for yourself.
That brings us to the Gold v. Silver ratio going back in time. I believe the that Silver is attractive relative to Gold when the ratio is higher than 60:1 (currently 62:1). The level we're at now on the Gold Silver ratio. At the height of the financial crisis the spread was as wide as 90:1. Gold in tremendous demand relative to Silver. 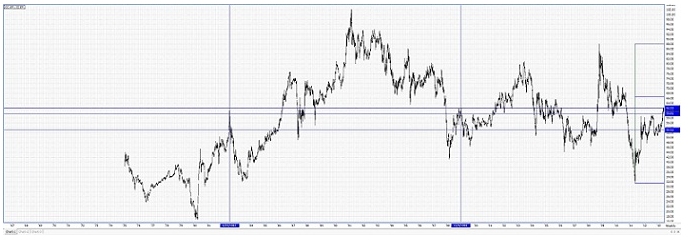
In the Spring of 2011, Silver was the belle of the Commodity ball and the ratio dropped back to 35:1 - which ironically (?) is where the Hunt Brothers efforts brought the spread to in 1980. Without going into some monotone walk through history (like Ben Stein in Ferris Bueller's Day Off) let's just point out that the Gold Reserve Act of 1934 outlawed private possession of Gold and re-pegged Gold from $20.67/oz to $35/oz (Devaluation pre fiat). This was when we had Silver dollar coins; hence 35:1 is viewed as a meaningful relationship level.
I believe Silver retested the low end of the range this morning at $22/oz. I would be surprised to see it trade much lower, but if it does break I think somewhere between $18 and $20/oz will be a tremendous opportunity. (Silver has both "precious" as well as "industrial" qualities - so the "growth" story can stimulate SI prices as well as inflationary fears).
From a trading standpoint, the options are pricing genuine concern about a Fed pullback in September (October options cycle).
Fed Funds futures point to about a 25 basis point hike by the end of 2015. April of 2016 - infer a 50 basis point move. Hmmmmm?
Last two visuals - the Fed's balance sheet. As the constantly self promoting Gartman would say, "it goes from lower left to the upper right". As I mentioned before, at some point they will need to start unwinding that position. That said, there is a good reason for the admonition against "Fighting the Fed" - they have unlimited funds and it's a losing proposition. 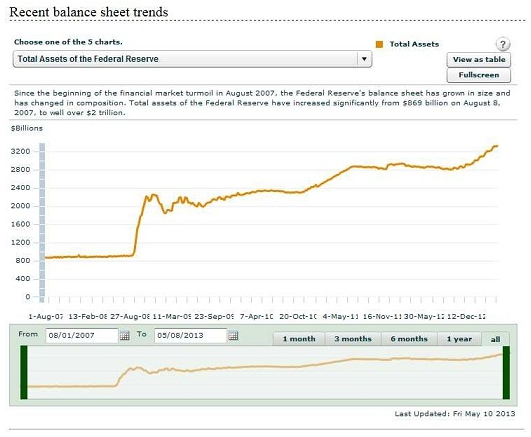
Finally, see how well the S&P has tracked the growth of the Fed's balance sheet? In recent months we've seen Commodities pricing in either deflation/China slowdown, a cessation in QE, or the likelihood of a much stronger US Dollar (some combination of these things). The Equity ramp has continued unabated. Again, maybe I'm missing something because I hope that the Global Economy can go "cold turkey". I hope that the tax hikes and slight improvements in the Employment situation continue to dent the budget deficit. I hope Congress gets the Fiscal House in order. I hope that manufacturing operations continue to repatriate. I hope that Energy "independence" efforts continue because that's a huge boon for our trade deficits. I hope that we have a genuine Housing Renaissance. Most of all, I hope to see companies really start hiring and wages pick up because THAT is an organic growth story I can believe in.
However, at the risk of being a wet blanket, what I continue to see is an economy producing marginal low end service jobs, a (shadow) banking system that's still levered to the nines, and a Central Bank that's painted into a corner.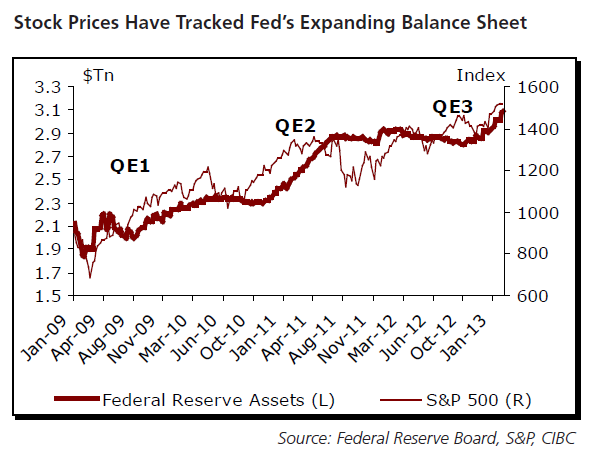
Feel free to share your thoughts. If you care to discuss the broad market, metals, energies, currencies, bonds, etc., give me a call.
- English (UK)
- English (India)
- English (Canada)
- English (Australia)
- English (South Africa)
- English (Philippines)
- English (Nigeria)
- Deutsch
- Español (España)
- Español (México)
- Français
- Italiano
- Nederlands
- Português (Portugal)
- Polski
- Português (Brasil)
- Русский
- Türkçe
- العربية
- Ελληνικά
- Svenska
- Suomi
- עברית
- 日本語
- 한국어
- 简体中文
- 繁體中文
- Bahasa Indonesia
- Bahasa Melayu
- ไทย
- Tiếng Việt
- हिंदी
Relationship Thoughts (GC v. S&P, GC v. SI, FOMC v. S&P, etc)
Published 05/17/2013, 02:21 PM
Updated 07/09/2023, 06:31 AM
Relationship Thoughts (GC v. S&P, GC v. SI, FOMC v. S&P, etc)
3rd party Ad. Not an offer or recommendation by Investing.com. See disclosure here or
remove ads
.
Latest comments
Install Our App
Risk Disclosure: Trading in financial instruments and/or cryptocurrencies involves high risks including the risk of losing some, or all, of your investment amount, and may not be suitable for all investors. Prices of cryptocurrencies are extremely volatile and may be affected by external factors such as financial, regulatory or political events. Trading on margin increases the financial risks.
Before deciding to trade in financial instrument or cryptocurrencies you should be fully informed of the risks and costs associated with trading the financial markets, carefully consider your investment objectives, level of experience, and risk appetite, and seek professional advice where needed.
Fusion Media would like to remind you that the data contained in this website is not necessarily real-time nor accurate. The data and prices on the website are not necessarily provided by any market or exchange, but may be provided by market makers, and so prices may not be accurate and may differ from the actual price at any given market, meaning prices are indicative and not appropriate for trading purposes. Fusion Media and any provider of the data contained in this website will not accept liability for any loss or damage as a result of your trading, or your reliance on the information contained within this website.
It is prohibited to use, store, reproduce, display, modify, transmit or distribute the data contained in this website without the explicit prior written permission of Fusion Media and/or the data provider. All intellectual property rights are reserved by the providers and/or the exchange providing the data contained in this website.
Fusion Media may be compensated by the advertisers that appear on the website, based on your interaction with the advertisements or advertisers.
© 2007-2024 - Fusion Media Limited. All Rights Reserved.