One of the most widely discussed stocks right now is Apple (AAPL) given its recent correction after hitting a high of $705 on 9/21. What has caused many investors to take notice is the fact that the stock has also declined beneath its 200-dma, perhaps the most popular of all technical indicators.
While the recent decline in AAPL may have surprised some investors, it should not have. One of the very first things I learned in my studies of technical analysis was to look for divergences…negative divergences at tops and positive divergences at bottoms. AAPL has just provided us with a textbook example of a negative divergence.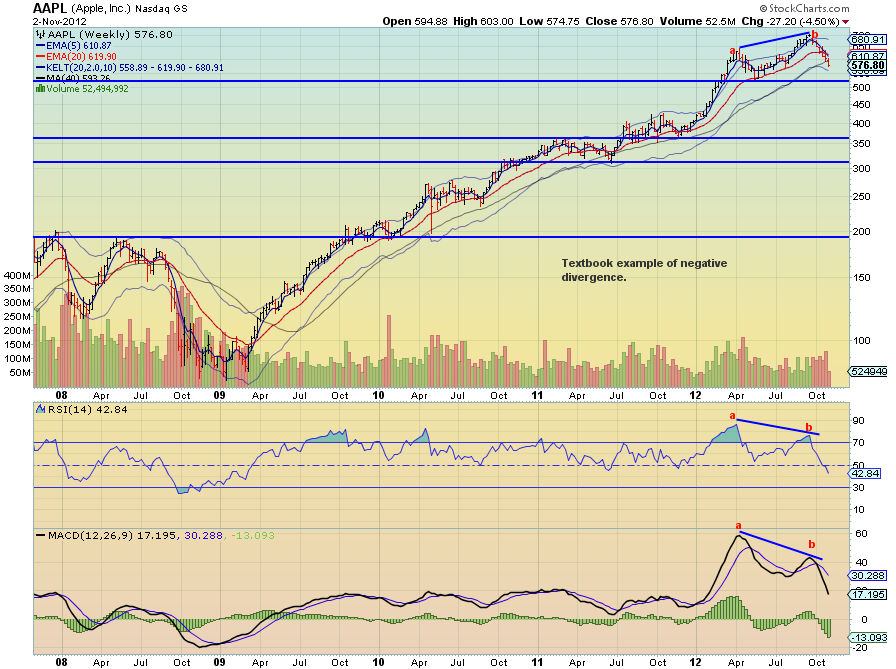
The above is a weekly chart of AAPL going back a few years. Note that when the stock recently peaked at its high how both RSI and MACD created classic divergences by failing to reach their own respective new highs. Folks, they don’t make them any more obvious than this.
The final nail shows up on the daily chart: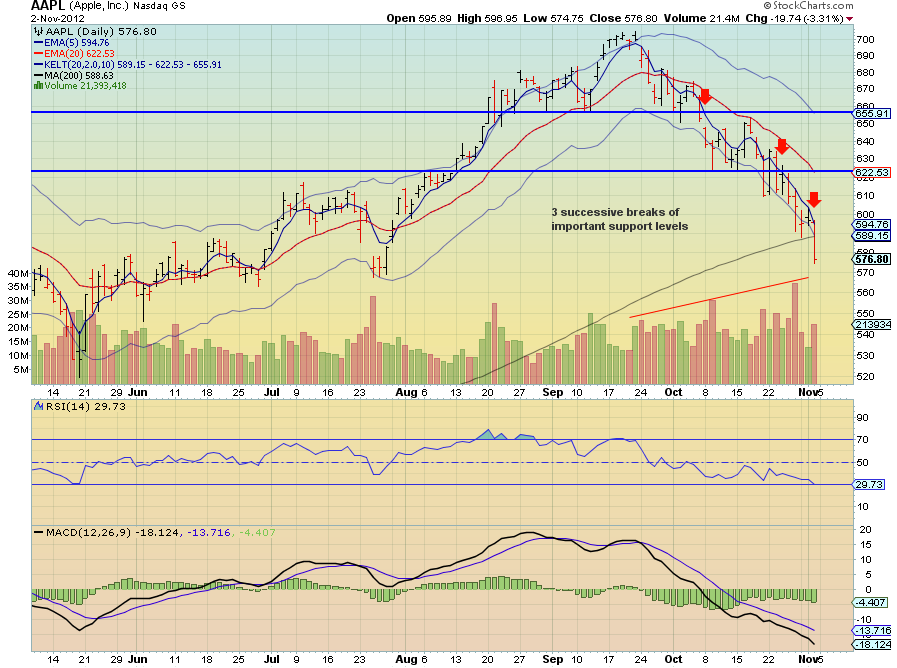
After prices peaked at over $700, observe how the first pullback paused around the $655…a level the stock had also paused at on its ascent. The stock next actually gapped lower, tested the $655 area again, (now resistance) and established a temporary floor around $620.
Once that level gave away, prices have quickly now come down to test (and penetrate) the all-important 200-dma. And while I dont have it pictured, I will point out that on a Point-and-Figure chart AAPL has also issued a successive series of sell signals at $655, $625, and again at $610. Will prices continue lower? I think so.
On the weekly chart I have placed levels which I think will attract some buying interest. I don’t necessarily think the market will make a beeline for these levels but for right now all you need to know is that supply is greater than demand.
It’s hard to comment on AAPL without also taking a look at the broader markets. When a recent market leader is taken to the woodshed, what does that portend for the general market. Not surprising, the action in AAPL and the general market closely parallel each other. Below is a chart of the SPY (SPDR S&P 500). 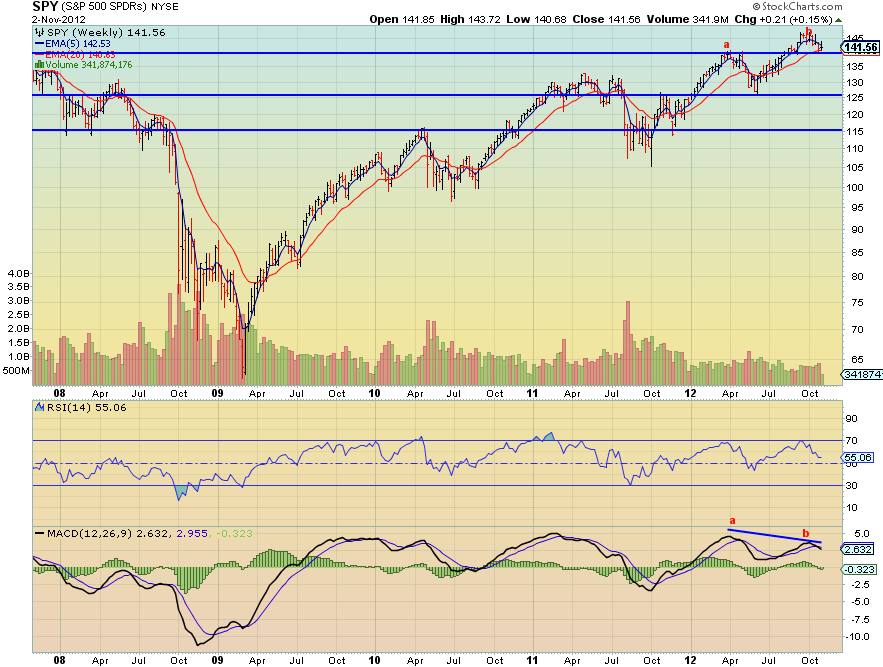
The $140 level in the SPY is vitally important to the health of the market. I think it is no surprise that the market has been testing that level over the past week. I do believe that the next test, which could occur this coming week, will fail and lead to lower prices. I have indicated some levels that should offer some initial price support.
The same pattern is uniform across the market. Here is the Russell 2000 (IWM):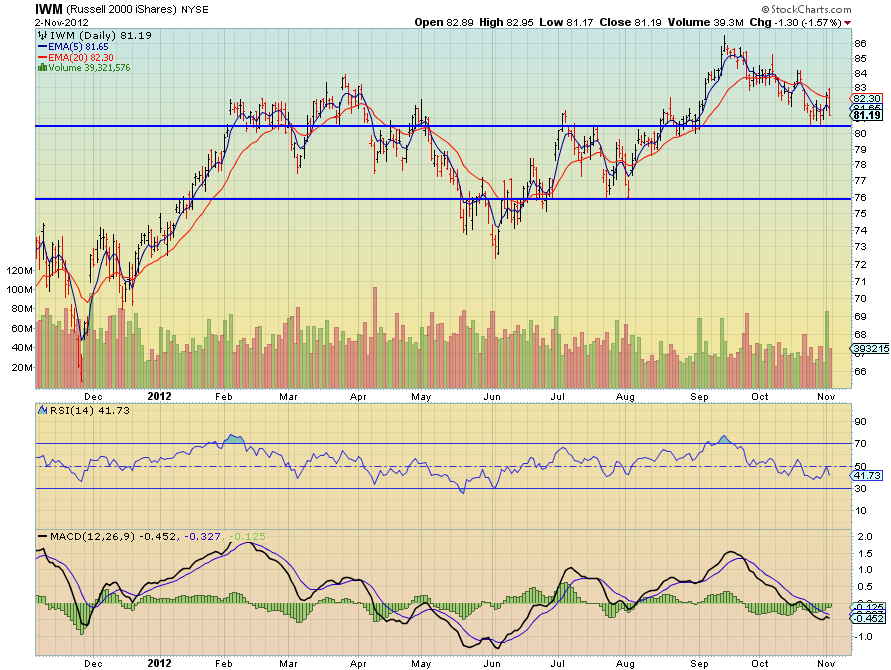
Below $80 should bring forceful selling in the smallcaps. Investors looking to hedge might want to consider RWM (ProShares Short Russell 2000).
The biotechs, one of this year’s leaders, are also showing signs of breaking down: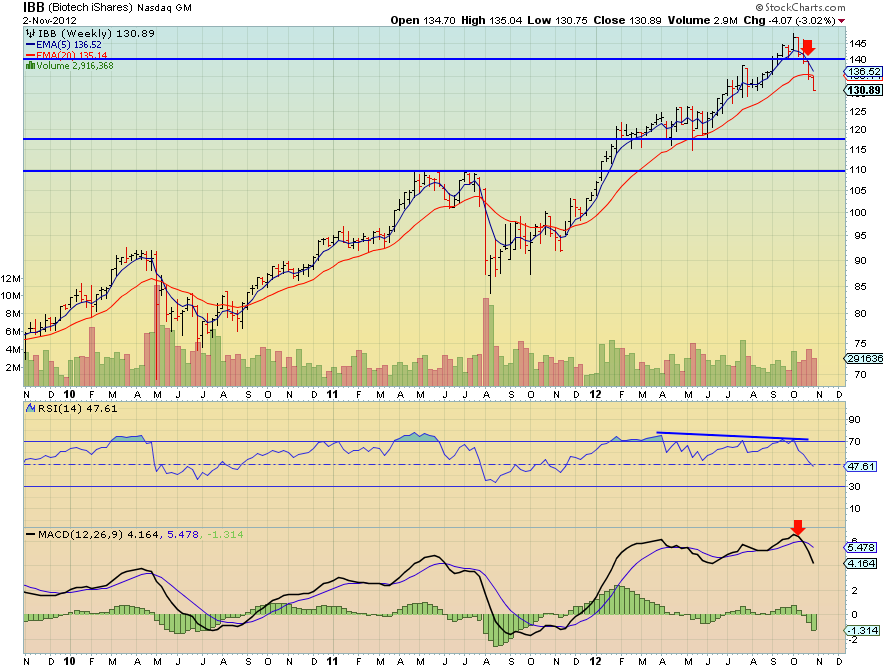
It is not uncommon to see the higher beta areas of the market lead on the downside. Within the biotech sector I have spotted a number of really nice shorting opportunities. ETF investors may want to consider (BIS), (Proshares Ultrashort Nasdaq Biotechnology).
- English (UK)
- English (India)
- English (Canada)
- English (Australia)
- English (South Africa)
- English (Philippines)
- English (Nigeria)
- Deutsch
- Español (España)
- Español (México)
- Français
- Italiano
- Nederlands
- Português (Portugal)
- Polski
- Português (Brasil)
- Русский
- Türkçe
- العربية
- Ελληνικά
- Svenska
- Suomi
- עברית
- 日本語
- 한국어
- 简体中文
- 繁體中文
- Bahasa Indonesia
- Bahasa Melayu
- ไทย
- Tiếng Việt
- हिंदी
Reading The Tea Leaves: Why Decline In Apple Stock Should Be No Surprise
Published 11/05/2012, 05:12 AM
Updated 07/09/2023, 06:31 AM
Reading The Tea Leaves: Why Decline In Apple Stock Should Be No Surprise
3rd party Ad. Not an offer or recommendation by Investing.com. See disclosure here or
remove ads
.
Latest comments
Install Our App
Risk Disclosure: Trading in financial instruments and/or cryptocurrencies involves high risks including the risk of losing some, or all, of your investment amount, and may not be suitable for all investors. Prices of cryptocurrencies are extremely volatile and may be affected by external factors such as financial, regulatory or political events. Trading on margin increases the financial risks.
Before deciding to trade in financial instrument or cryptocurrencies you should be fully informed of the risks and costs associated with trading the financial markets, carefully consider your investment objectives, level of experience, and risk appetite, and seek professional advice where needed.
Fusion Media would like to remind you that the data contained in this website is not necessarily real-time nor accurate. The data and prices on the website are not necessarily provided by any market or exchange, but may be provided by market makers, and so prices may not be accurate and may differ from the actual price at any given market, meaning prices are indicative and not appropriate for trading purposes. Fusion Media and any provider of the data contained in this website will not accept liability for any loss or damage as a result of your trading, or your reliance on the information contained within this website.
It is prohibited to use, store, reproduce, display, modify, transmit or distribute the data contained in this website without the explicit prior written permission of Fusion Media and/or the data provider. All intellectual property rights are reserved by the providers and/or the exchange providing the data contained in this website.
Fusion Media may be compensated by the advertisers that appear on the website, based on your interaction with the advertisements or advertisers.
© 2007-2024 - Fusion Media Limited. All Rights Reserved.
