RBNZ and PMIs in the spotlight
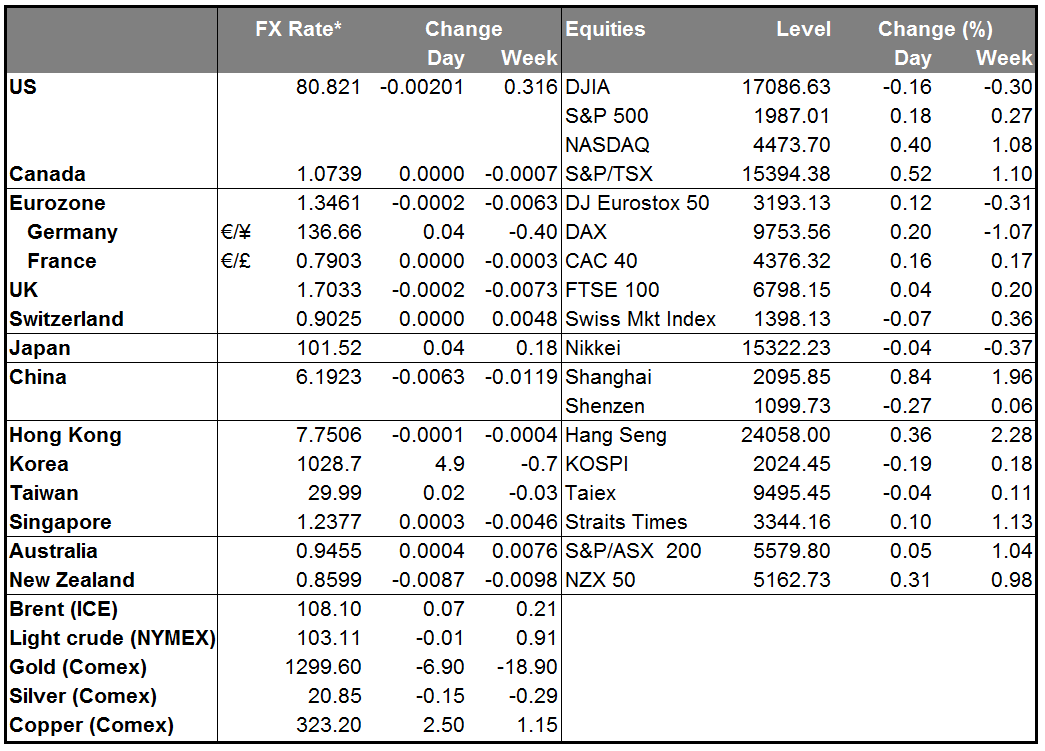
Once again there was a decent amount of news that resulted in relatively little movement. The EUR/USD had the second-smallest range of the year at 0.14% (lowest was 0.11% on April 18th). The market ignored reports that two Ukrainian fighter jets were shot down, apparently from the Russian side of the border, according to the Ukrainian government. Gold was lower despite the news. The only G10 currencies to weaken notably against the dollar were NZD (see below) and GBP, which fell yesterday on the dovish implications of the Bank of England minutes. On the other hand, the AUD strengthened after the provisional HSBC/Markit China manufacturing PMI for July rose to 52.0 from 50.7, beating expectations of 51.0.
The Reserve Bank of New Zealand raised its official cash rate (OCR) by 25 bps
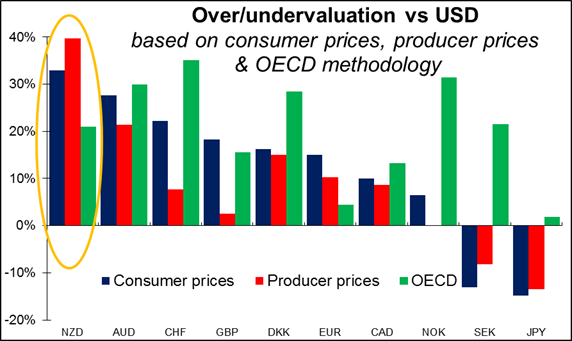
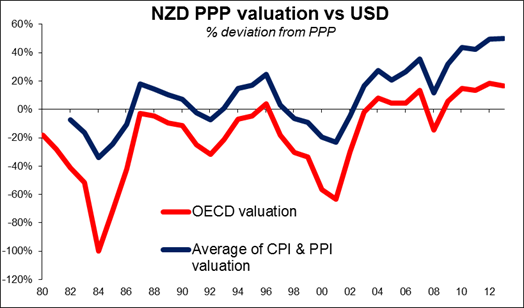
As was generally expected, but said it would pause for “a period of assessment before interest rates adjust further towards a more-neutral level.” In other words it will continue to hike, but first wants to see how the 100 bps of hikes so far are affecting the economy. The RBNZ had harsh words to say about its currency. "Over recent months, export prices for dairy and timber have fallen, and these will reduce primary sector incomes over the coming year. With the exchange rate yet to adjust to weakening commodity prices, the level of the New Zealand dollar is unjustified and unsustainable and there is potential for a significant fall," the RBNZ said. It’s hard to argue with their contention that the currency is overvalued; on both CPI and PPI basis it’s the most overvalued of the G10 currencies (33% and 40% overvalued vs USD, according to Bloomberg calculations). The OECD’s calculations put it in the middle of the pack, but even there it’s 21% overvalued, according to their calculations (the most overvalued on this methodology is CHF at +35%, while the yen is merely +2% overvalued). In general, currencies do tend to revert back towards their purchasing power parity (PPP) values, but it can take a long, long time. So long as the RBNZ keeps real interest rates the highest among the G10 (indeed, is the only central bank with a positive real official rate), NZD should be well supported.
Japan’s trade balance continued to worsen
The deficit for June was JPY 1.08tn (SA), vs JPY 862bn (SA) in June. Although this was better than market estimates, the NSA figure for the trade balance was worse, giving a mixed picture. The problem was exports, which fell 2.0% yoy instead of rising 1.0% as expected, while imports were in line with estimates at +8.4% yoy. Japan’s exports are not benefitting from the weaker yen, while of course import prices have risen in line with the drop in the currency. This could be the fatal flaw in Abenomics: the weaker yen winds up reducing aggregate demand by reducing households’ purchasing power without boosting exports, thus causing further deflation! The Japan manufacturing PMI fell to 50.8 from 51.5. I remain bearish on the yen, although it’s hard to say what will be the catalyst to push it out of its recent range. 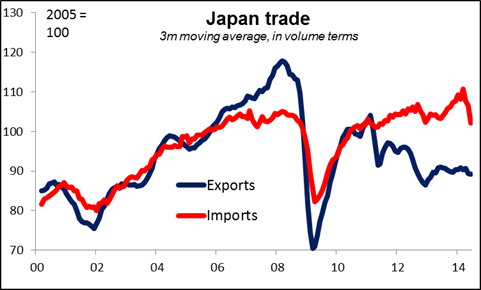
Today: The PMIs will take center stage during the European day. Eurozone’s preliminary PMIs for July will be released just after the two largest countries of the bloc, Germany and France, release their figures for the same month. Both the manufacturing and service sector PMIs for the Eurozone are expected to decline slightly, reflecting the overall slowdown in growth and economic turbulence in the region. That could add to the sense that the Eurozone’s only hope is a weaker currency and push EUR down slightly.
Sweden’s official unemployment rate for June is coming out and the forecast is for the rate to increase to 9.0% from 8.0%, consistent with the increase in the Public Employment Service (PES) unemployment rate earlier this month. The weaker labor data will most likely offset the recent promising rise in the CPI --following the shock in the unexpected official rate cut by Riksbank— of a moderate rebound in the Swedish economy and could be negative for SEK.
In the UK, retail sales excluding gasoline are expected to rise 0.3% mom, a turnaround from -0.5% mom in the previous month. That should be positive for the pound.
Later in the day, we get the US preliminary Markit manufacturing PMI for July (expected to rise) and new home sales for June (expected to fall). The initial jobless claims for the week ended 19th of July are forecast to rise marginally.
The Market
EUR/USD ahead of Eurozone’s PMIs
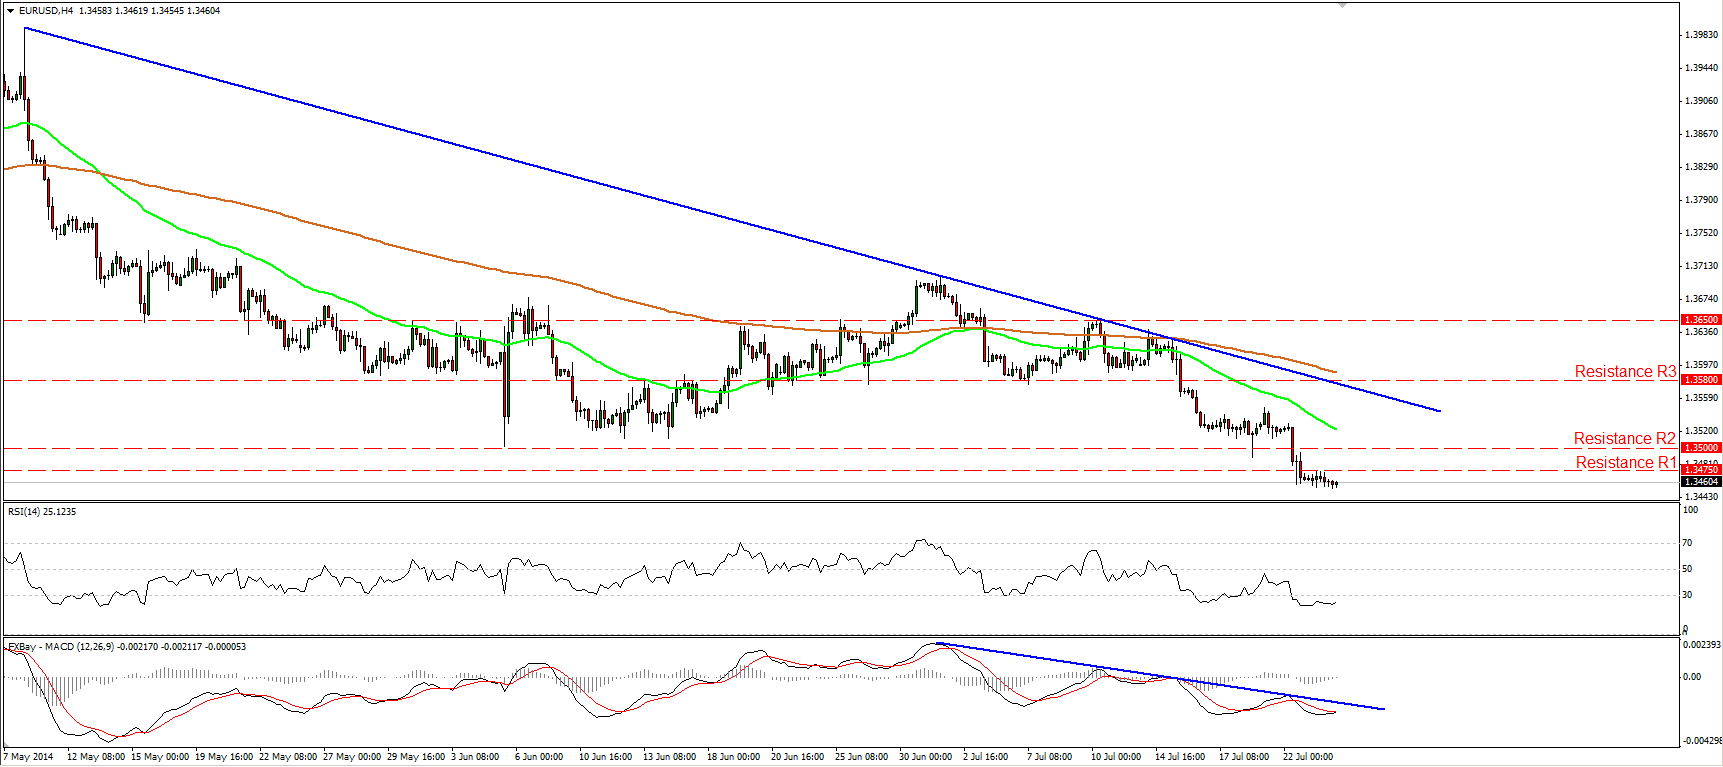
The EUR/USD moved in a consolidative mode on Wednesday ahead of Eurozone’s preliminary PMI data for July. The rate remains slightly below the lows of February at 1.3475 (R1) with the euro-area PMIs, coming out later in the day, expected to show a modest decline. This could cause the bears to regain momentum and push the pair lower, perhaps towards the support zone of 1.3400 (S1), marked by the low of the 21st of November. As long as EUR/USD remains below both the moving averages and the 1.3500 (R1) key resistance holds, I see a negative near-term picture. On the daily chart, the 50-day moving average is still touching the 200-day one and a bearish cross in the near future will add to the negative outlook of the pair.
• Support: 1.3400 (S1), 1.3300 (S2), 1.3250 (S3)
• Resistance: 1.3475 (R1), 1.3500 (R2), 1.3580 (R3)
USD/JPY ready to challenge 101.60
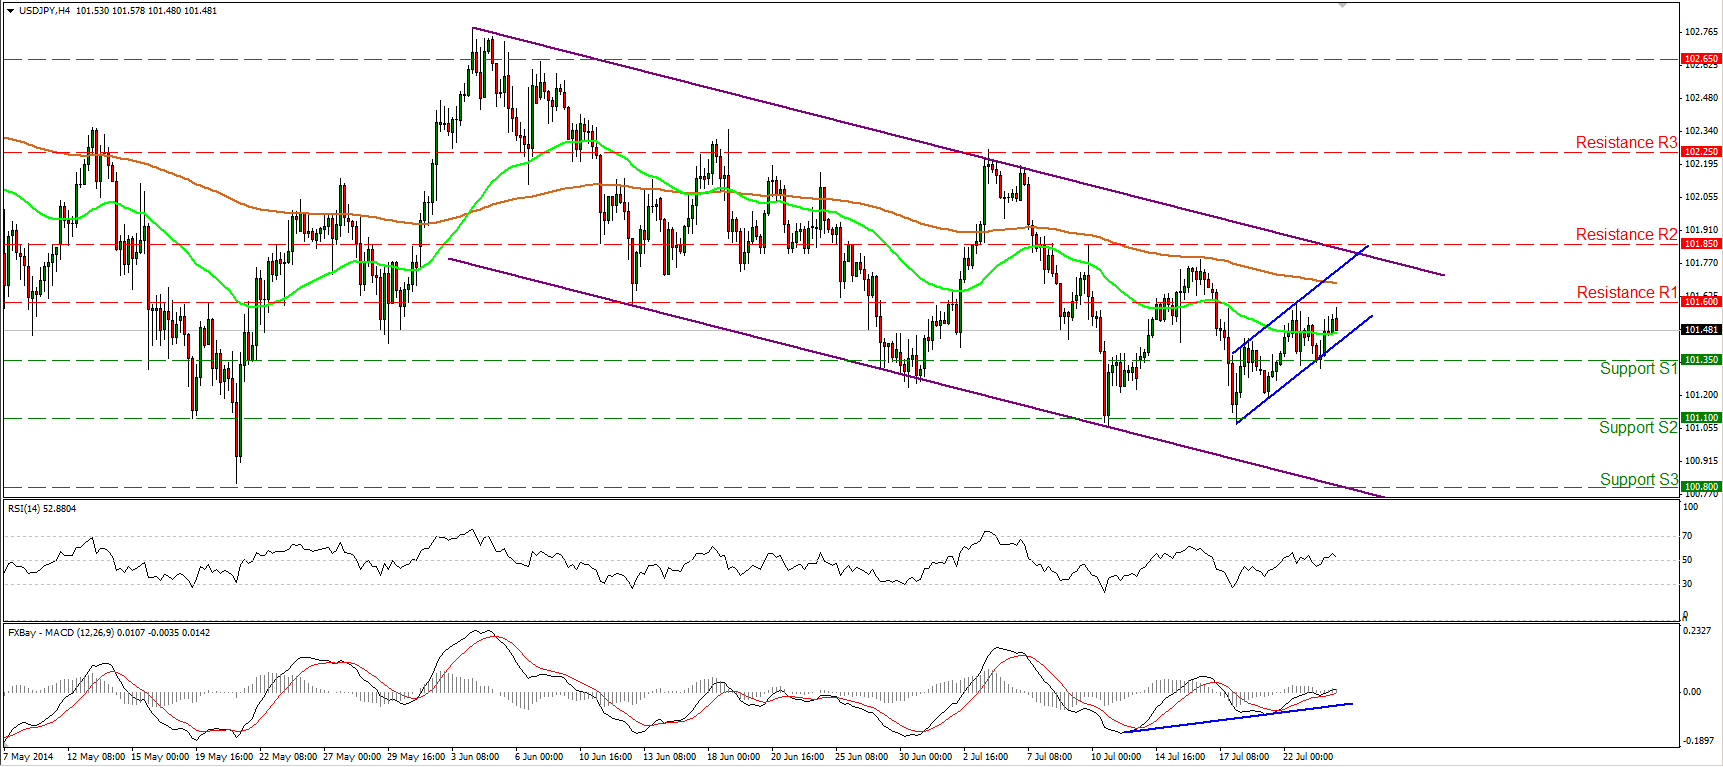
The USD/JPY rebounded from 101.35 (R1) and at the time of writing is heading towards the resistance of 101.60 (R1). I still expect the bulls to find the strength to overcome that barrier and drive the rate up to the 101.85 (R2), zone, near the crossroad of the upper bound of the purple channel and the upper boundary of the minor-term upside blue channel. Even though I expect the upside wave to continue, the overall short-term picture of the pair remains to the downside, since the rate is still trading within the purple downside channel. Bearing that in mind, I would see any upside waves within the channel as corrective waves.
• Support: 101.35 (S1), 101.10 (S2), 100.80 (S3)
• Resistance: 101.60 (R1), 101.85 (R2), 102.25 (R3)
EUR/GBP rebounds from 0.7875
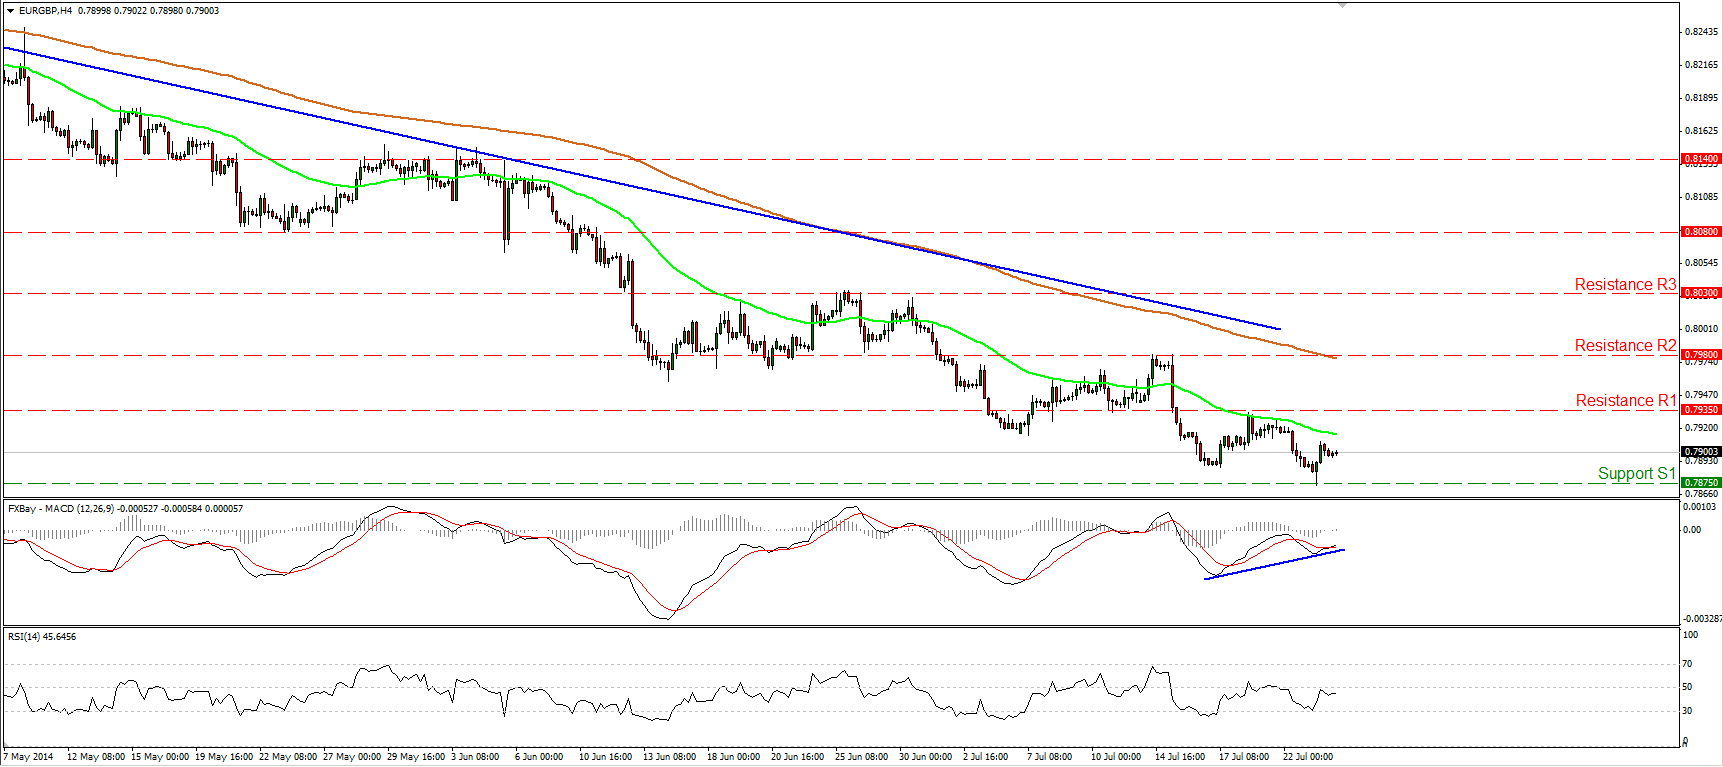
The EUR/GBP moved slightly higher yesterday, after finding support near the 0.7875 (S1) zone. Although the overall trend remains to the downside (marked by the downtrend line drawn from back the 11th of April), I see negative divergence between the MACD and the price action, indicating the lack of the necessary bearish momentum, at least for now. Also, bearing in mind that the indicator crossed above its signal line and is now pointing up, I cannot rule out the continuation of the upside corrective wave, perhaps towards the resistance of 0.7935 (R1). On the daily chart, I see negative divergence between the price action and both the daily MACD and the 14-day RSI, corroborating my view that the downtrend is the best to rely on.
• Support: 0.7875 (S1), 0.7815 (S2), 0.7755 (S3)
• Resistance: 0.7935 (R1), 0.7980 (R2), 0.8030 (R3)
Gold below 1300 again
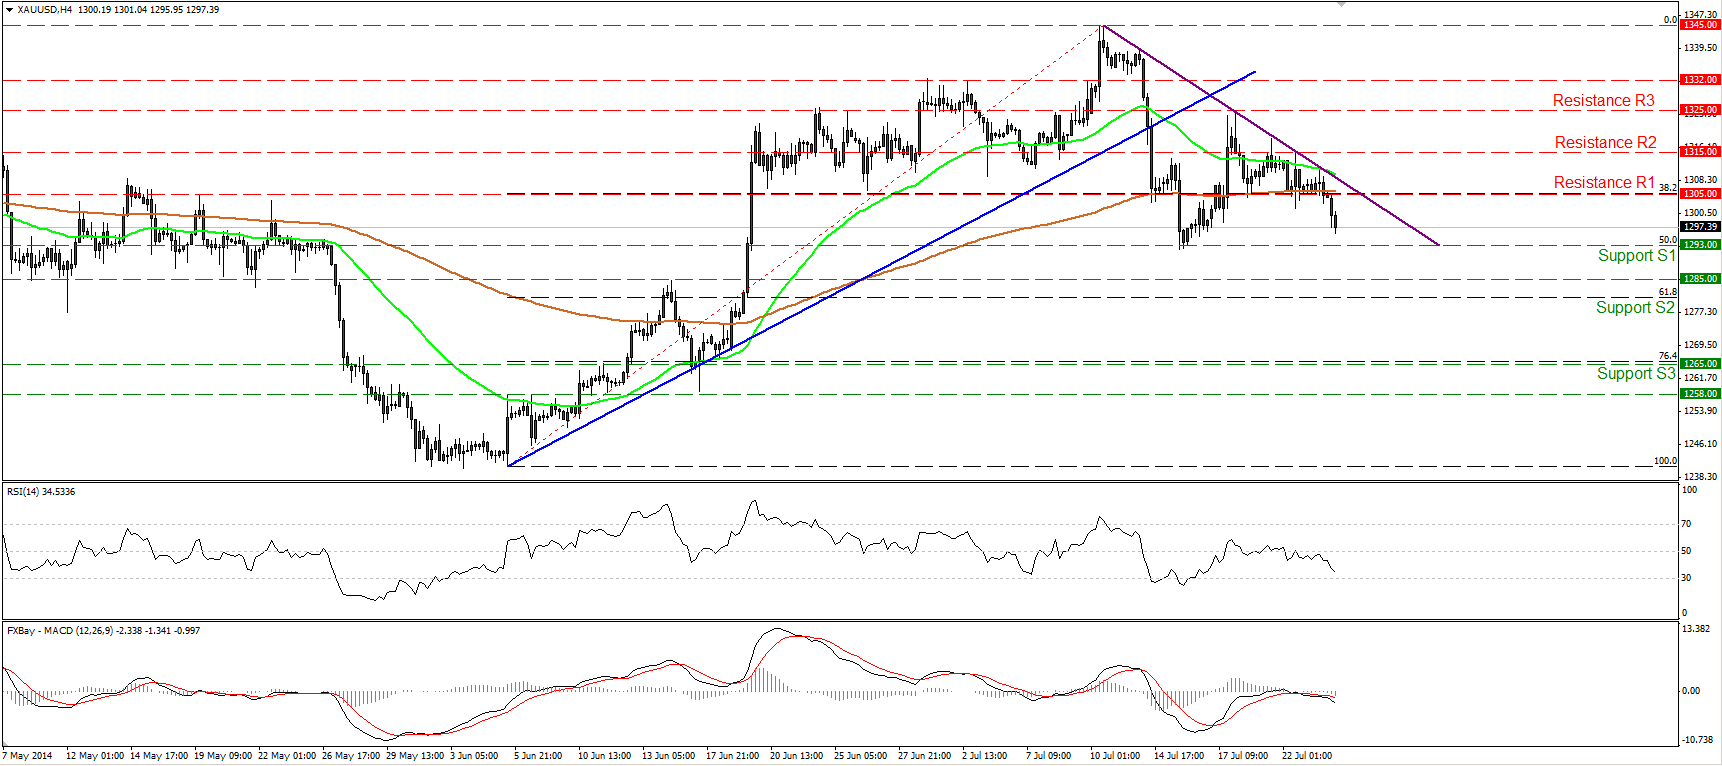
Gold declined significantly, falling below the 1305 barrier (support turned into resistance) and the 200-period moving average. The yellow metal is likely to challenge the 1293 (S1) support level, which coincides with the 50% retracement level of the 5th of June – 10th July uptrend. In my view, the price has the necessary momentum to challenge that barrier since the RSI has further to go before signaling oversold conditions, while the MACD left its neutral line and also dipped below its signal line. A clear break below 1293 (S1) could pave the way towards the next obstacle at 1285 (S2), slightly above the 61.8% retracement level of the aforementioned uptrend.
• Support: 1293 (S1), 1285 (S2), 1265 (S3)
• Resistance: 1305 (R1), 1315 (R2), 1325 (R3)
WTI rebounds as stockpiles decline
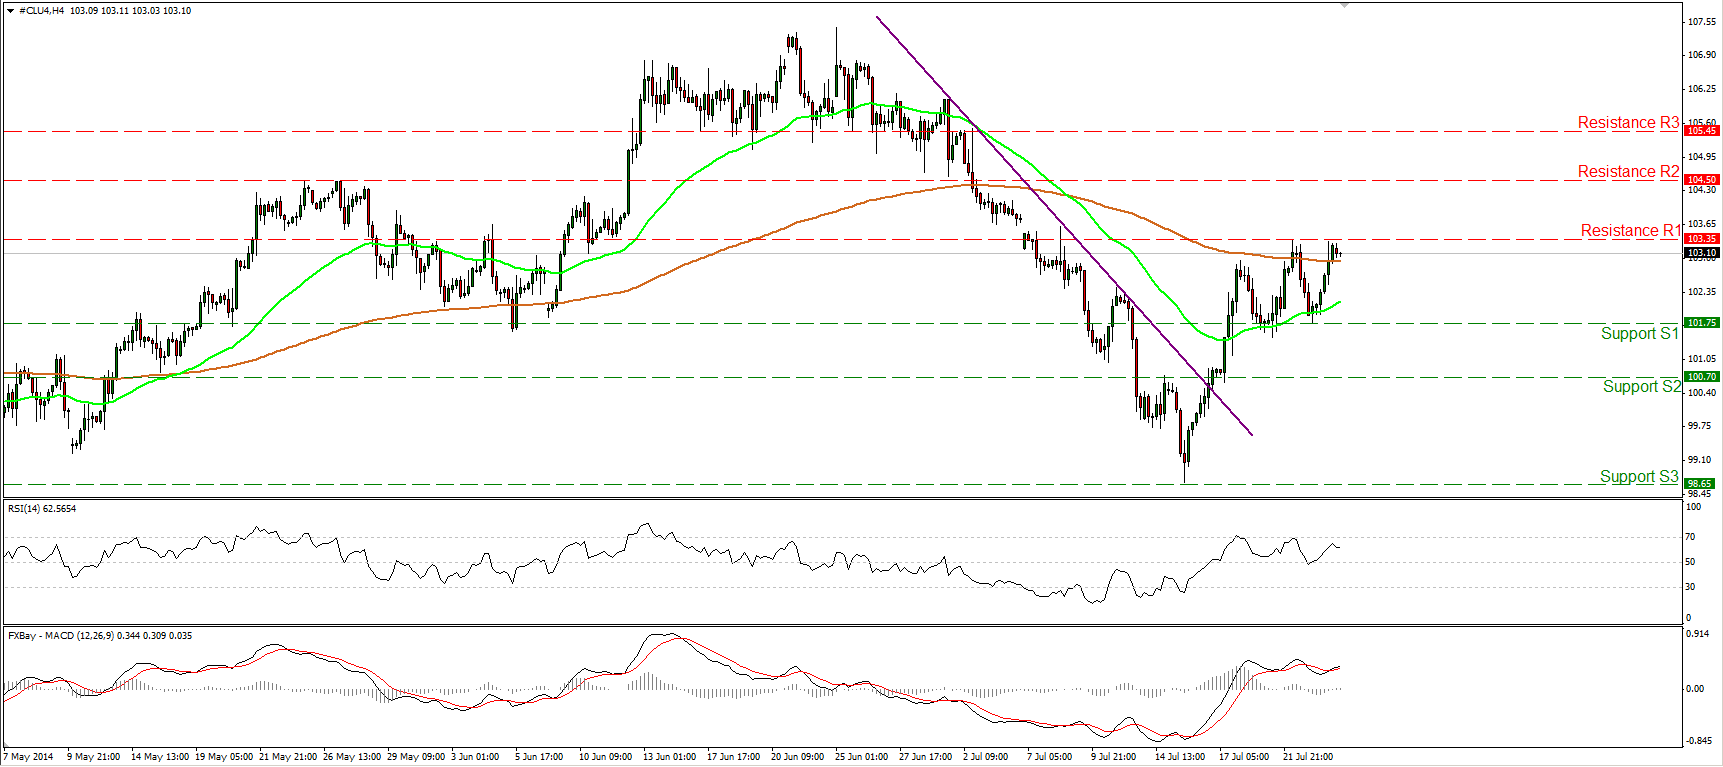
WTI rebounded from 101.75 (S1) yesterday and edged higher after the EIA reported that US crude oil inventories declined by 4.0mn barrels in the week ended on July 18, below estimates of a 2.8mn decline. The price is now testing the resistance marked by the prior high, at 103.35 (R1), where a decisive break could reinforce the near-term uptrend and target the next resistance level at 104.50 (R2). The RSI rebounded from its 50 level and moved higher, while the MACD, already in its positive field, crossed above its signal line, confirming yesterday’s bullish momentum.
• Support: 101.75 (S1), 100.70 (S2), 98.65 (S3)
• Resistance: 103.35 (R1), 104.50 (R2), 105.45 (R3)

