
Raymond James (NYSE:RJF) reported third-quarter fiscal 2019 (ended Jun 30) earnings per share of $1.80, which lagged the Zacks Consensus Estimate of $1.86. However, on a year-over-year basis, earnings increased 16%.
Results were adversely impacted by rise in operating expenses and weak investment banking performance. However, improvement in net revenues, on the back of rise in short term interest rates and loan growth, provided some support.
Net income totaled $259 million, up 12% year over year.
Revenues & Costs Rise
Net revenues amounted to $1.93 billion, growing 5% year over year. The rise was largely driven by an increase in interest income, partially offset by decline in investment banking fees and total brokerage revenues. Also, the top line beat the Zacks Consensus Estimate of $1.92 billion.
Segment wise, in the reported quarter, RJ Bank registered an increase of 14% in net revenues. Capital Markets witnessed a rise of 3% in the top line, while Private Client Group recorded 6% growth. Further, Asset Management witnessed a 5% rise in top line, while Others recorded negative revenues.
Non-interest expenses were up 4% year over year to $1.59 billion. The increase was mainly due to rise in almost all cost components.
As of Jun 30, 2019, client assets under administration grew 9% from the prior-year quarter to $824.2 billion. Further, financial assets under management increased 6% to $143.1 billion.
Balance Sheet Strong, Capital Ratios Improve
As of Jun 30, 2019, Raymond James reported total assets of $38.7 billion, up 1% sequentially. Total equity increased 2% from the prior quarter to $6.5 billion.
Book value per share was $46.54, up from $42.24 as of Jun 30, 2018.
As of Jun 30, 2019, total capital ratio came in at 25.2%, increasing from 24.8% on Jun 30, 2018. Also, Tier 1 capital ratio was 24.2% compared with 23.8% as of June 2018 end.
Return on equity (annualized basis) was 16.1% at the end of the reported quarter, up from 15.4% in the prior-year quarter.
Share Repurchase Update
During the fiscal third quarter, Raymond James repurchased nearly 1.04 million shares for $85 million.
Our Take
Raymond James remains well positioned to grow via acquisitions, given its strong liquidity position. However, mounting expenses are likely to continue hurting bottom-line growth. Additionally, dismal investment banking performance is a major near-term concern.
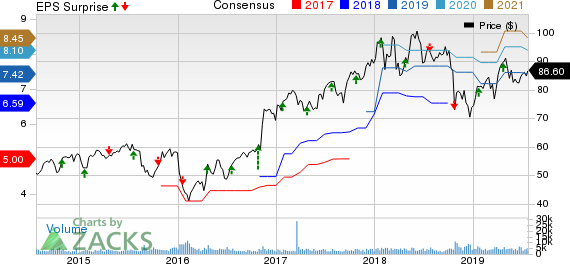
Raymond James Financial, Inc. Price, Consensus and EPS Surprise
Raymond James Financial, Inc. price-consensus-eps-surprise-chart | Raymond James Financial, Inc. Quote
Currently, the company has a Zacks Rank #4 (Sell).
You can see the complete list of today’s Zacks #1 Rank (Strong Buy) stocks here.
Performance of Other Investment Brokerage Firms
Charles Schwab’s (NYSE:SCHW) second-quarter earnings of 66 cents per share came in line with the Zacks Consensus Estimate. Also, the bottom line jumped 10% from the prior-year quarter.
E*TRADE Financial (NASDAQ:ETFC) delivered a positive earnings surprise of 1.8% for the June-ended quarter. Adjusted earnings of $1.12 per share comfortably surpassed the Zacks Consensus Estimate of $1.10. Moreover, the results compared favorably with the prior-year quarter’s 95 cents.
Interactive Brokers Group, Inc.’s (NYSE:IBKR) second-quarter 2019 earnings per share of 43 cents lagged the Zacks Consensus Estimate of 48 cents. Moreover, the figure compared unfavorably with the prior-year quarter’s earnings of 57 cents.
This Could Be the Fastest Way to Grow Wealth in 2019
Research indicates one sector is poised to deliver a crop of the best-performing stocks you'll find anywhere in the market. Breaking news in this space frequently creates quick double- and triple-digit profit opportunities.
These companies are changing the world – and owning their stocks could transform your portfolio in 2019 and beyond. Recent trades from this sector have generated +98%, +119% and +164% gains in as little as 1 month.
Click here to see these breakthrough stocks now >>
E*TRADE Financial Corporation (ETFC): Free Stock Analysis Report
The Charles Schwab Corporation (SCHW): Free Stock Analysis Report
Interactive Brokers Group, Inc. (IBKR): Free Stock Analysis Report
Raymond James Financial, Inc. (RJF): Free Stock Analysis Report
Original post