
It has been about a month since the last earnings report for Raymond James Financial, Inc. (NYSE:RJF) . Shares have lost about 6% in the past month, underperforming the market.
Will the recent negative trend continue leading up to its next earnings release, or is RJF due for a breakout? Before we dive into how investors and analysts have reacted as of late, let's take a quick look at the most recent earnings report in order to get a better handle on the important drivers.
Raymond James Q1 Earnings & Revenues Beat Estimates
Raymond James announced first-quarter fiscal 2018 (ended Dec 31) adjusted earnings per share of $1.61, which surpassed the Zacks Consensus Estimate of $1.43. Also, on a year-over-year basis, the bottom line surged 33%.
Results were primarily driven by an increase in net revenues, reflecting solid investment banking strength. Also, growth in assets acted as a tailwind. However, higher expenses were on the downside.
Taking into consideration the impact of tax act and acquisition-related expenses, net income for the quarter totaled $118.8 million or 80 cents per share, reflecting a decline from $146.6 million or $1.00 per share, reported in the year-ago quarter.
Revenues Improve, Costs Rise
Net revenues for the quarter amounted to $1.73 billion, rising 16% year over year. The rise was attributable to an increase in almost all the revenue components, except other income and net trading profits. Further, the reported figure beat the Zacks Consensus Estimate of $1.70 billion.
Segment wise, in the reported quarter, RJ Bank registered an increase of 20% in net revenues. Further, Asset Management and Private Client Group depicted top-line improvement of 32% and 19%, respectively. However, Capital Markets witnessed a decline of 7% in net revenues, while Others reported negative revenues.
Non-interest expenses increased 10% year over year to $1.41 billion. The rise was largely due to an increase in all cost components, except acquisition-related costs that declined 69% and lower other expenses as well as business development costs.
As of Dec 31, 2017, client assets under administration increased 18% on a year-over-year basis to $727.2 billion, while financial assets under management surged 63% to $130.3 billion.
Strong Balance Sheet, Capital Ratios Improve
As of Dec 31, 2017, Raymond James reported total assets of $36.1 billion, increasing 3.4% sequentially. Further, total equity rose 1.8% on a sequential basis to $5.7 billion.
Book value per share was $39.25, up from $35.55 as of Dec 31, 2016.
As of Dec 31, 2017, total capital ratio came in at 23.4%, increasing from 22.2% as of Dec 31, 2016. Also, Tier 1 capital ratio was 22.4%, compared with 21.2% in the year-ago period.
Also, adjusted return on equity came in at 16.8% at the end of the reported quarter, up from 14.0% a year ago.
Fiscal 2018 Outlook
Management projects net interest margin to be in the range of 3.10-3.20%.
Management expects the acquisition of Scout Investments and its Reams Asset Management division to generate nearly $18 million of revenues per quarter.
The company expects pre-tax margin to reach over 17%. Moreover, compensation ratio is anticipated to be less than 67%.
Raymond James targets to achieve ROE in the range of 14-15%.
Management expects communication and information processing costs to be in the high 80s per quarter. Business development expenses are expected to be at the higher end of the $30-$40 million range per quarter.
Management projects blended federal statutory tax rate of 28%.
How Have Estimates Been Moving Since Then?
In the past month, investors have witnessed a downward trend in fresh estimates. There have been two revisions lower for the current quarter.
Raymond James Financial, Inc. Price and Consensus
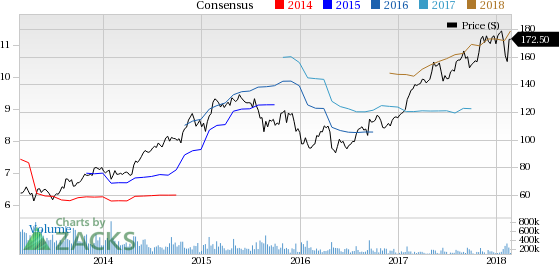
Raymond James Financial, Inc. Price and Consensus | Raymond James Financial, Inc. Quote
VGM Scores
At this time, RJF has a subpar Growth Score of D, however its Momentum is doing a lot better with a B. Charting a somewhat similar path, the stock was also allocated a grade of A on the value side, putting it in the top 20% for this investment strategy.
Overall, the stock has an aggregate VGM Score of B. If you aren't focused on one strategy, this score is the one you should be interested in.
Our style scores indicate that the stock is more suitable for value investors than momentum investors.
Outlook
Estimates have been broadly trending downward for the stock, and the magnitude of these revisions indicates a downward shift. Interestingly, RJF has a Zacks Rank #2 (Buy). We expect an above average return from the stock in the next few months.
Raymond James Financial, Inc. (RJF): Free Stock Analysis Report
Original post
Zacks Investment Research