Each month our Rational Risk Equity Income Investor letter uses a rules-based method to identify three lists of high quality dividend stocks:
- Quantitative List – based on purely objective historical quantitative criteria, including a minimum current yield
- Subjective List - subset of the Quantitative List, based on favorable forward looking recommendations by independent analysts
- Performance List – subset of the Subjective List, based on maximum historical volatility and maximum historical negative rolling return limits
:
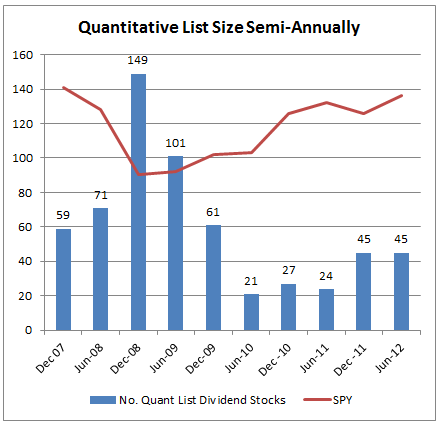
- how the number of Quantitative List qualifiers has varied over time
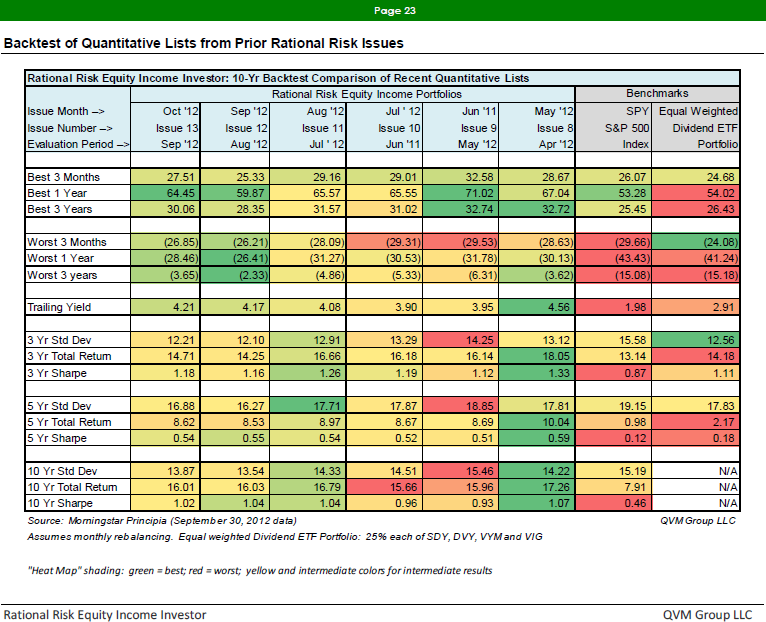
- how the Quantitative Lists generated in each of the past 6 months have done on a long-term rolling return basis
- 10-year quarterly differences between Quantitative List performance and the S&P 500
- the specific rules used to select the Quantitative List
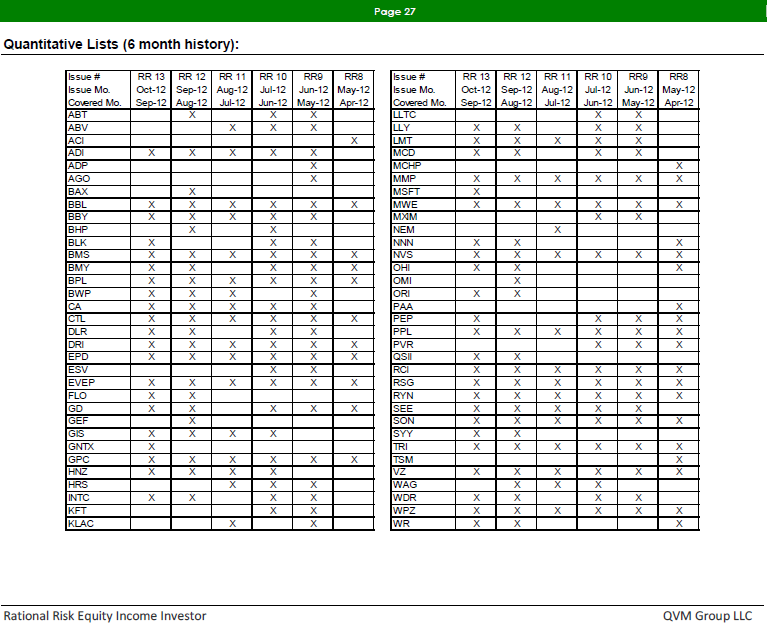
- the symbols for the stocks in the Quantitative List in each of the last 6 months
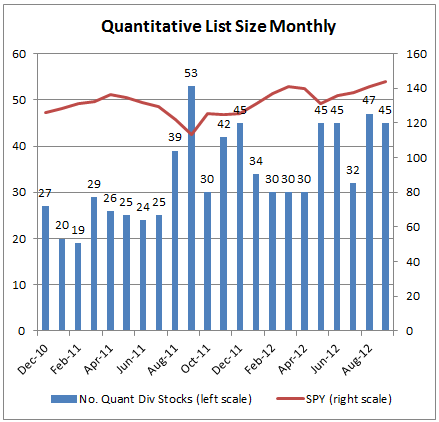
The S&P 500 (proxy SPY) is plotted on the chart with the number of stocks that pass the Quantitative filter to illustrate how the change in the broad index price level tends to change the number of stocks with yields that meet the minimum level required by the rules. All of the rules other than current yield are independent of price level.
FIGURE 2: QUANT LIST STOCKS MONTHLY SINCE 2010
FIGURE 3 (Rational Risk letter page 23)
This table shows a variety of performance data from the last 1o0 years for the Quantitative List from each of the past 6 months versus the S&P 500 (proxy SPY) and an equal weight portfolio of four leading dividend ETFs (SDY, DVY, VIG and VYM). Generally, each Quantitative List when held in equal weight and rebalanced monthly, has outperformed both the S&P 500 and the equal weight portfolio of dividend ETFs.
The data points are:
- Best 3 months
- Best 1 year
- Best 3 years
- Worst 3 months
- Worst 1 year
- Worst 3 years
- Trailing yield
- 3-year standard deviation
- 3-year total return
- 3-year Sharpe Ratio
- 5-year standard deviation
- 5-year total return
- 5-year Sharpe Ratio
- 10-year standard deviation
- 10-year total return
- 10-year Sharpe Ratio

FIGURE 4(from Rational Risk letter page 6 for each of past 6 monthly issues)
No approach, no matter how well it may work in the long-term, outperforms in all short-term periods. This set of histograms shows the difference for the past 40 quarters (10-years) between the total of the S&P 500 and the equal weight, monthly rebalanced Quantitative List. Generally when the broad market is moving up strongly, the Quantitative List will underperform (not decline, but not rise as far or fast). Similarly, the Quantitative List tends to outperform in periods when the broad market declines or is flat. Figure 3 above, shows that over a period of years, the Quantitative Lists have outperformed.
FIGURE 5 (Rational Risk letter page 27)
The stocks that qualify for the Quantitative list vary in number and sector classification over time as the broad market price levels rise and fall, and as sector rotation within the broad market occurs. The table below presents the full list of Quantitative List stocks for each of the past 6 monthly issues of the Rational Risk Equity Income Investor letter. 
QUANTITATIVE LIST METHODOLOGY
We discuss our quantitative method in this article, and will discuss our subjective and performance methods and results in subsequent articles.
The quantitative list is based on current and historical data, and does not include forward looking data. The minimum yield criterion will vary over time based on interest rates. The minimum 5-year dividend growth rate criterion will vary over time based on the inflation rate.
Quantitative Filter Criteria
— Broad Scope:
- Price > = $5.00
- Market capitalization >= $250 million
- Current dividend yield >= 3%
- 5-year dividend growth rate >=3%
- Per minute 3-month average dollar trading volume >= $25,000
- Dividends paid in each of the past 5 full calendar years
- Dividends were not decreased in any of the past 5 fiscal years
- Dividends paid over the last 4 quarters (1,2,3,4) >= dividends paid over prior 4 quarters (5,6,7,8)
- Revenue growth over last 5 years >=3%
- Revenue growth over last 3 years >=3%
- Revenue growth over last 1 years >=0%
– Profitability:
- Cumulative cash flow from operations last 3 years > $0.00
- Cumulative cash flow from operations last 5 years > $0.00
– Dividend Coverage:
- Cumulative dividends paid in last 5 fiscal years
- Cumulative dividends paid in last 12 months
Each issue identifies the three lists Quantitative, Subjective and Performance; and then provides these data for each list:
- best and worst period, yield and rolling returns versus that of the S&P 500 and each of four dividend ETFs (SDY, DVY, VIG and VYM)
- Equity style boxes and super sector allocation
- Portfolio statistics (such as P/E and others)
- 40-quarter return differential versus S&P 500
- Sector and industry classification of each stock
- Cross reference of each stock with holdings of 7 dividend ETFs (SDY, DVY, VIG, VYM, HDV,FVD, FDL)
- Growth rates for sales, earnings and dividends for each stock
- Solvency metrics for each stock
- 10-year dividend payback estimates for each stock
- Valuation metrics for each stock
- Total returns for multiple periods for each stock
- Links to websites and price charts for each stock
- Backtest rolling returns for each of the three lists for the past 6 monthly issues of the letter
- Comparison of list composition for each of the three lists for each of the past 6 monthly issues
- Full detail disclosure of methodology
No list of filtered stocks is certain or guaranteed to outperform, or to be free of individual stocks that due poorly going forward, nor to be immune from the gravitational pull of a declining stock market.
It is always appropriate for investors to evaluate individual stocks, including those in our Quantitative, Subjective or Performance lists in terms of personal suitability, and an appropriately allocated portfolio which would include other types securities than just dividend stocks.
Some stocks, particularly in the Quantitative List, while financially sound, are in the list because their price has deteriorated.
Stocks in the Subjective List may or may not be in uptrends, but are attractive to independent analysts, however may or may not turn out to be better opportunities than other stocks in the Quantitative List.
The Performance List consists of those Quantitative List stocks that pass the Subjective List criteria, and have also avoided certain minimum drawdowns and volatility, but are also not certain to perform in any particular way in the future.
