With about 60% of the S&P 500 having reported Q4 ’15 financial results, S&P 500 earnings growth “ex-Energy” is +2.10%, with revenue growth just barely positive at +0.90%. Here is the working spreadsheet, data courtesy of David Aurelio of ThomsonReuters as of 2/5/16: FC – SP500exEnergy2516
It does not look like core S&P 500 earnings will meet the 5% bogey that I thought it might hit just one month ago, for Q4 ’15. Maybe even more concerning is that Q1 ’16 S&P 500 earnings and revenue estimates per the above Thomson data, don’t look encouraging either.
Q1 ’16 S&P 500 earnings growth ex-Energy is expected at just +0.40%, with expected revenue growth slightly higher at +2.4%.
The point of all the above navel gazing is that “core” S&P 500 earnings are slowing, more than I thought originally. (It is somewhat unusual that Q1 ’16 revenue growth is expected to be stronger than Q1 ’16 S&P 500 earnings growth, but see the comments below on the US dollar for some possible edification.)
Bigger Picture:
With 2015 S&P 500 earnings expected to be flat to +/-1% and now 2016’s bottom-up EPS estimate reflecting low single-digit growth, two years of what could be essentially zero earnings growth is a “P/E compressing event” for the stock market for sure.
Personally I thought the other sectors would shake off the Energy and Basic Materials drags, particularly Technology and Financials, but that has not been the case.
US Dollar Impact:
The comment below was cut-and-pasted from CNBC morning anchor, Carl Quintanilla’s Twitter) feed on Friday morning, February 5th, quoting Tom Lee, the former JP Morgan Equity Strategist who is now out on his own, managing money. I’ve always liked Tom’s work since it is S&P 500 earnings-based. When he has been on CNBC I usually concurred with his market opinions, thanks primarily to his fundamental rationale.
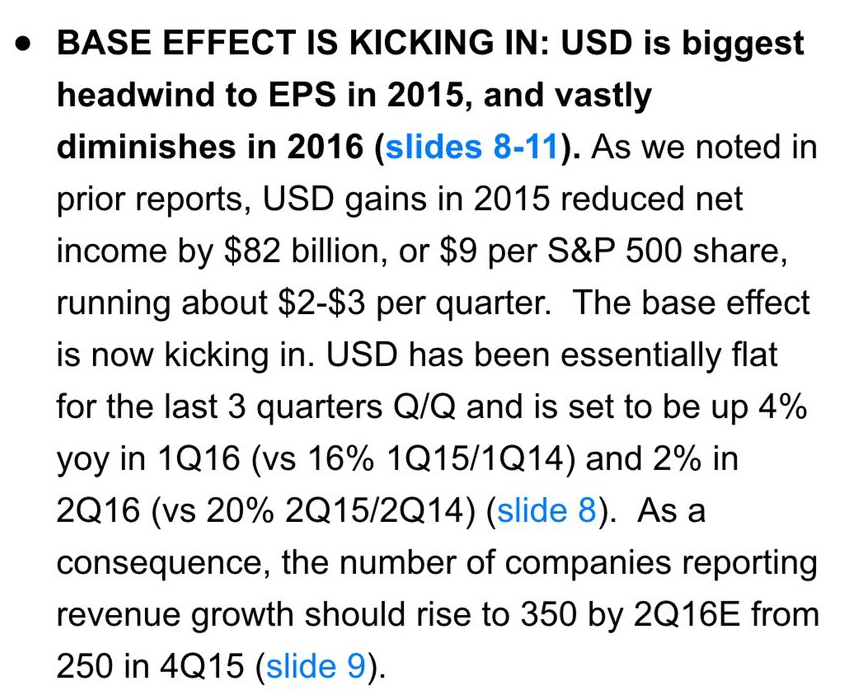
Tom Lee’s rationale is one “ray of hope” for S&P 500 earnings estimates for 2016. Particularly for the Industrial and Tech sectors, when you listen to the earnings calls, the dollar is a significant drag on stated revenue numbers:
To my knowledge, Thomson and Factset haven’t disclosed this kind of hard data on the dollar’s impact of the S&P 500, but Tom Lee quantifies the dollar impact succinctly:
The dollar index, which peaked at just over 100 last March ’16, traded sideways for the remaining 9 months of 2015, between 98-100, looks to have finally broken down this past week, to 95-96. If this lower trend continues, and per Tom Lee’s work, I think it would be a significant plus for the S&P 500, one of the few bright spots out there for S&P 500 earnings, and even though the dollar’s impact would be only “translational” at first.
S&P 500 earnings by the numbers: (data courtesy of Thomson’s This Week in Earnings):
- Forward 4-quarter estimate: fell this week to $122.50 from last week’s $123.06
- P.E ratio on forward estimate: 15(x)
- PEG ratio: still way elevated at 8.76(x)
- S&P 500 earnings yield: 6.52%, also still very elevated, versus last week’s 6.34%
- Y/Y growth rate of forward estimate: +1.75% versus last week’s 2.08%
Analysis / conclusion: There is an old saying in investing that, “It is OK to be wrong but it is not OK to stay wrong”, and the forward S&P 500 earnings and revenue data look pretty grim after this week, with the one bright spot being that US dollar has finally cracked and started to weaken. There is a brutal, rolling rotation occurring which seemed to move from US large-cap Financials last week, to US large-cap Technology and FANG this week. This is always the challenge with truly great businesses that have stocks that look perennially-overvalued and can remain that way for years.
Astute investors have to be patient and buy these stocks when they look heavily oversold even though valuation’s still look stretched, with the stock’s down significant percentages from their peaks. That is certainly the case today with the FANG names. Using the SPY Growth vs Value ETFs, Growth is down about 9.5% year-to-date while Value is down about 6%, thus Value is starting to outperform Growth, after a 900 basis point performance gap in 2016.
The S&P 500 is down is about 12% from its 2,135 highs in mid-2015. The S&P 500 remains above its January 20th, 2016 low of 1,812.
There are many doubters as to whether the S&P 500 can rally from these levels and remain above the January 20th, 2016 lows of 1,812.
Personally I do think the dollar’s strength or weakness over the next few months matters. After listening to so many conference calls and reading so many research reports on the dollar’s impact the last 15-18 months, I think it could be one bright spot in a sea of problems.
Next up, a quick look at how full-year 2016 earnings data has changed since January 1 ’16.

