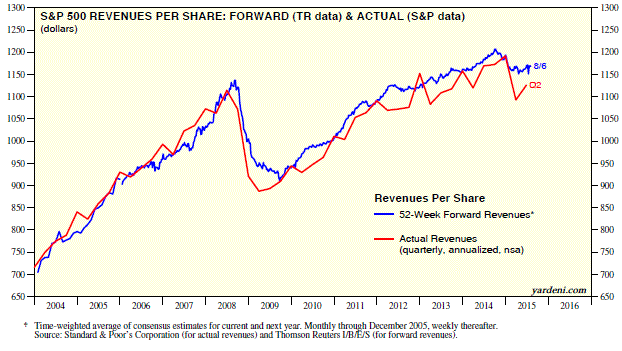
S&P released Q2 data on revenues, earnings, and margins for the S&P 500 on Friday. I like to compare the operating earnings-per-share data compiled by S&P to the similar earnings composite calculated by Thomson Reuters I/B/E/S (TR). I prefer the TR series because it is aligned with industry analysts’ earnings estimates.
S&P sticks to Generally Accepted Accounting Principles (GAAP). One big difference between S&P and TR operating earnings in recent quarters has been the way the two account for asset impairment within S&P 500 Energy companies. These have impacted the direction of operating margins recently. (TR doesn’t publish a reported earnings-per-share or a revenues-per-share series, but both must be identical to the one published by S&P.) I know: You probably can’t stand the suspense any longer, so let’s have a closer look at the data:
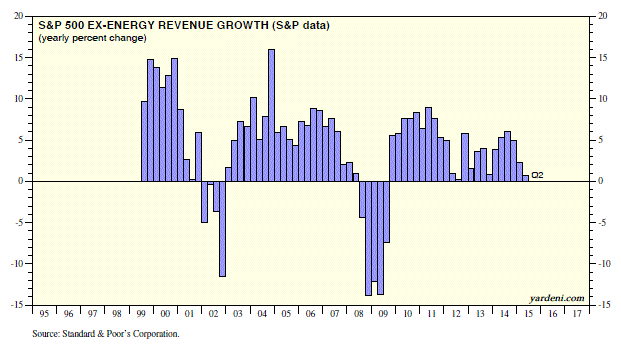
(1) In sum, both the S&P and TR data show that both revenues and earnings fell on a y/y basis during Q2 for the S&P 500. However, most of the decline was attributable to plunging Energy revenues and earnings. Excluding this sector, the growth rates were better, but subdued as the strong dollar also weighed on company results. Writeoffs also weighed heavily on the S&P earnings number for the quarter. While TR’s profit margin for the S&P 500 rose to a new record high during Q2, the S&P figure was lower. An analysis of the S&P 500 sectors shows that Financials, Information Technology, and Utilities have been boosting the overall profit margin. Energy and Materials have weighed it down.
(2) S&P 500 revenues edged up from an annualized $1,092.76 per share during Q1 to $1,126.56 during Q2. They fell 3.7% y/y during Q2 following a 2.4% decline during Q1. These were the first such declines since Q4-2008 through Q3-2009. I calculate that revenues rose 2.3% and 0.7% during Q1 and Q2 excluding the Energy sector.
(3) S&P 500 earnings rose from an annualized $114.40 per share during Q1 to $120.20 during Q2 according to TR. On a year-over-year basis, I estimate S&P 500 earnings rose 2.1% during Q1 and 1.6% during Q2 on a pro-forma/same-company basis. On this same basis, I calculate that S&P 500 earnings rose 11.5% and 10.1% during the two quarters excluding Energy earnings.
Today's Morning Briefing: Piecing Together the Puzzle. (1) Lots of S&P 500 data on Q2 revenues, earnings, and margins. (2) Comparing S&P vs. Thomson Reuters earnings composites. (3) The big news was a new high for the S&P 500 profit margin by one measure. (4) Weak oil price and strong dollar aren’t likely to weigh on revenues and earnings next year. (5) Financials, IT, and Utilities profit margins at new highs. (6) Energy and Materials margins down. (7) LargeCap margins consistently exceed SMidCap margins. Why? (7) Small companies tend to be more labor-intensive than large ones. (8) Many may also be losing money.


