“Davidson” submits:
Thought this could stimulate some thinking.
I do not think that the relationship shown in this chart is only open to only one interpretation. But, the way I look at this is that investor perception means that they are always “fighting the last war.”
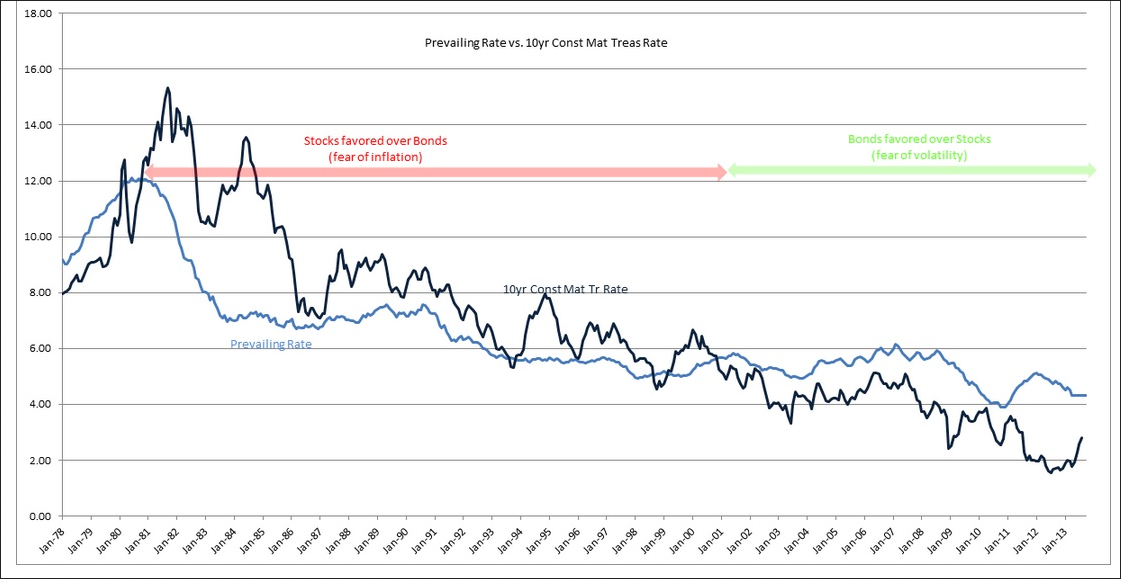
It appears that investors who had been heavily damaged by rising rates in 1970s finally favored stocks vs bonds in 1980. 10yr Treasury rates remained generally above the Prevailing rate till 2000 when sentiment changed due to the sharp correction after the Internet Bubble.
Since the Internet Bubble correction 10yr Treasuries have been favored over stocks with plummeting stocks increasing the trend towards Treasuries-see 2008 and 2011 when the spread widened.
I labeled the 1980-2000 period one in which investors feared inflation while the period from 2000-2013 reflects a fear of volatility.
Although there is a very rough correlation between the Prevailing Rate and 10yr Treasury Rates, this chart shows that investors seem to be always fighting the last period of uncertainty and this creates a psychological mind set which can last 20 years years.
Psychology is a huge market influence which cannot be predicted using the mathematical models so much in vogue. My expectation that a period of market over pricing is likely the next four to five years comes from recent market peaks in 2000 and 2007 when investors pushed up stocks to levels 100% and 55% above valuations estimated by the Prevailing Rate.
One is always making estimates about future market prices which are subject to revision based on how the market psychology develops at the time. With this context I can say the SP500 (SPY) has the potential to be priced in a range of $2,500-$4,000. One really cannot be more precise because the market psychology impact is impossible to predict even over short periods.
But, based on historical study one can expect the current pessimism towards stocks, i.e. very low 10yr Treas Rates, to turn at some point. There is so much capital buried in Treasuries globally that when this capital shifts towards stocks one can imagine an enormous period of equity performance. Just the same, it is impossible to predict when and how high! Experience tells us to expect it, watch for it and monitor the economic news on which past Bubbles were supported to find an exit point.
Until stocks run into significant Bubble territory peaking with the economic peak, i.e. when Auto&Lt Truck Sales peak, the market offers considerable potential for gains. We will be able to get some guidance on this when 10yr Treasury Rates turn higher as investors feel compelled to sell Fixed Income to buy Equity. My guestimate is that the 10yr Treasury Rate have to rise decently above the Prevailing Rate like the period of inflation fear before this market reaches a peak.
Thought this could stimulate some thinking.
I do not think that the relationship shown in this chart is only open to only one interpretation. But, the way I look at this is that investor perception means that they are always “fighting the last war.”
It appears that investors who had been heavily damaged by rising rates in 1970s finally favored stocks vs bonds in 1980. 10yr Treasury rates remained generally above the Prevailing rate till 2000 when sentiment changed due to the sharp correction after the Internet Bubble.
Since the Internet Bubble correction 10yr Treasuries have been favored over stocks with plummeting stocks increasing the trend towards Treasuries-see 2008 and 2011 when the spread widened.
I labeled the 1980-2000 period one in which investors feared inflation while the period from 2000-2013 reflects a fear of volatility.
Although there is a very rough correlation between the Prevailing Rate and 10yr Treasury Rates, this chart shows that investors seem to be always fighting the last period of uncertainty and this creates a psychological mind set which can last 20 years years.
Psychology is a huge market influence which cannot be predicted using the mathematical models so much in vogue. My expectation that a period of market over pricing is likely the next four to five years comes from recent market peaks in 2000 and 2007 when investors pushed up stocks to levels 100% and 55% above valuations estimated by the Prevailing Rate.
One is always making estimates about future market prices which are subject to revision based on how the market psychology develops at the time. With this context I can say the SP500 (SPY) has the potential to be priced in a range of $2,500-$4,000. One really cannot be more precise because the market psychology impact is impossible to predict even over short periods.
But, based on historical study one can expect the current pessimism towards stocks, i.e. very low 10yr Treas Rates, to turn at some point. There is so much capital buried in Treasuries globally that when this capital shifts towards stocks one can imagine an enormous period of equity performance. Just the same, it is impossible to predict when and how high! Experience tells us to expect it, watch for it and monitor the economic news on which past Bubbles were supported to find an exit point.
Until stocks run into significant Bubble territory peaking with the economic peak, i.e. when Auto&Lt Truck Sales peak, the market offers considerable potential for gains. We will be able to get some guidance on this when 10yr Treasury Rates turn higher as investors feel compelled to sell Fixed Income to buy Equity. My guestimate is that the 10yr Treasury Rate have to rise decently above the Prevailing Rate like the period of inflation fear before this market reaches a peak.
3rd party Ad. Not an offer or recommendation by Investing.com. See disclosure here or
remove ads
.