The Fed minutes were dovish and this helped push Gold above $1310 to $1320. However, the miners, which usually lead the metals did little to confirm the rise. In fact, the miners have been relatively weak in recent days and had a bearish reversal on Thursday. Their rebound from an oversold condition has petered out. Another point is Gold, during this rebound has made no progress against foreign currencies. It’s starting to show some strength against the equity market but it needs to show strength against all currencies and not function only as the inverse of the US Dollar. Be on alert as the short-term trend for precious metals (especially the miners) could resume to the downside.
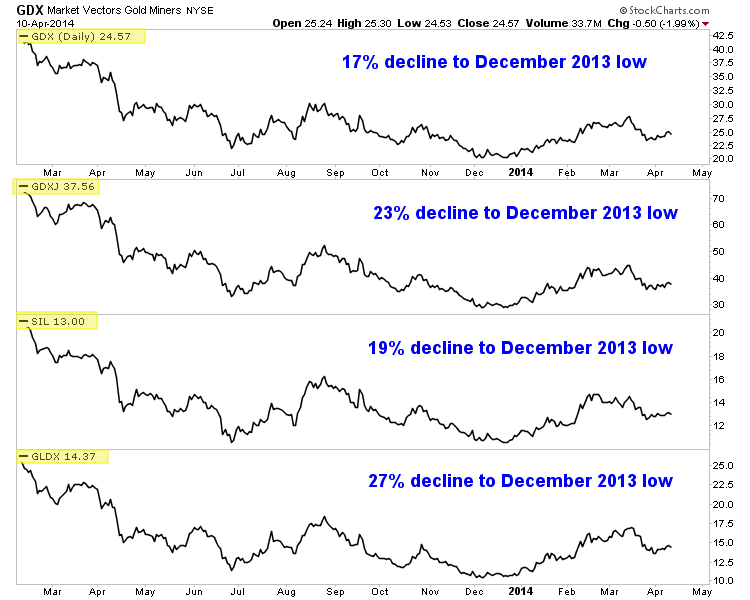
Looking further out, forthcoming weakness shouldn’t last that long in the big picture. The miners have been basing for quite a while and started to gain traction in Q1. The next low at worst could be a double bottom or otherwise would mark the first higher low in this bottoming process. In the chart below we plot Market Vectors Gold Miners (ARCA:GDX) (large caps), Market Vectors Junior Gold Miners (ARCA:GDXJ) (juniors), Silver (silver stocks) and Global X Gold Explorers (GLDX.K) (explorers). We note how much each would have to decline to test its December low.
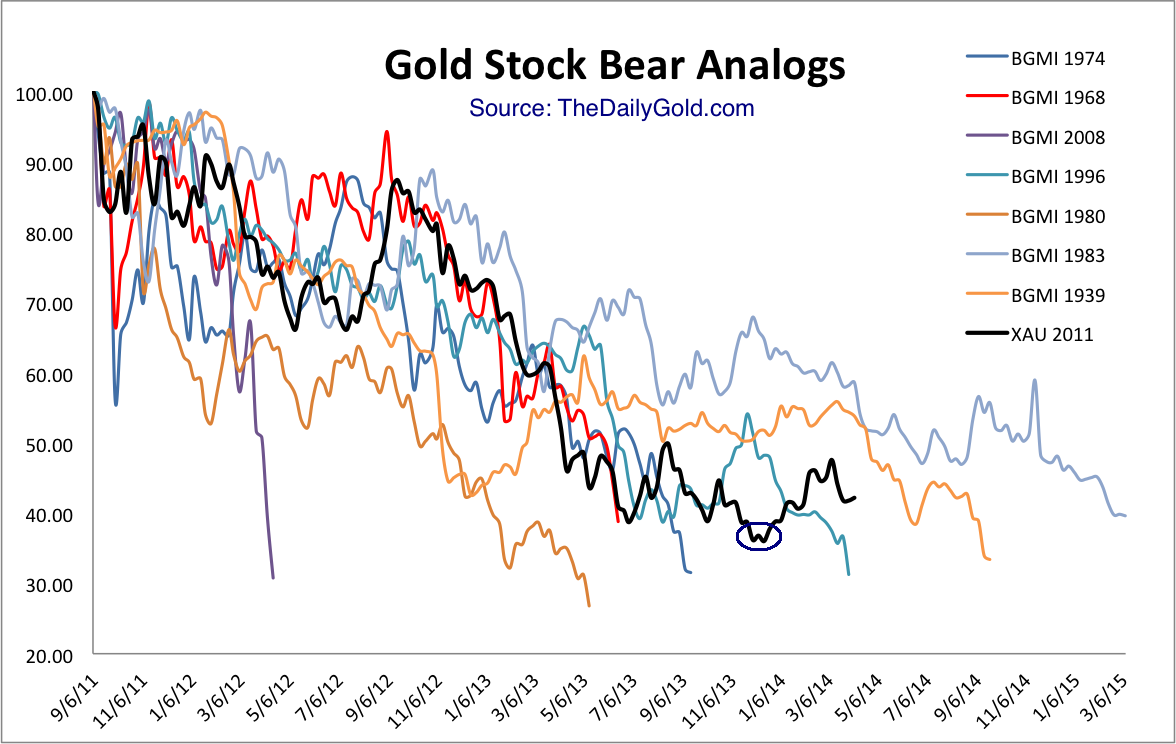
Our gold stock bear analogs chart, which helped us call the June 2013 low and anticipate the December 2013 low, makes a strong argument that the final low (on a weekly basis) occurred in December. The low is circled but we kept the plot going for further comparison. Compared to the present, there are only two bears that lasted longer and at present both were down less than 50%. Note that at the December low when gold stocks were down 64%, the three bears which lasted longer were off no more than 50%.
The 1996-1999 bear which ended at this time down 69% is an interesting case. It did reach lower levels in 2000 before the current secular bull started. However, after the 1999 low gold stocks exploded led by the ARCA Gold Miners index (forerunner to GDX) which surged 75% in a few months. Then the stocks consolidated for many months before popping again. During this brief 14-month respite the GDM gained 90%, the Philadelphia Gold/Silver 83% and the ARCA Gold BUGS 68%. After the bottom in 1999, GDM and XAU broke to new lows two years and two months later. The HUI, which was more attached to the epic junior bubble of the mid 1990s, reached new lows one year and nine months later.
Considering this history, even the most bearish person would have to admit that the market needs to consolidate for a while (as in way more than a year) to have any chance to reach new sustained lows. Gold stocks enjoyed a huge short covering rally shortly after the 1999 low. Yet even after the short covering ended the preceding bear market low wasn’t breached for roughly two years!
Why is this bottom taking so long? A few weeks ago we posited that it could be because of the extended topping process in 2011-2012. Perhaps that unusual topping process is giving way to an unusual bottoming process. In any event, the best plan is to wait patiently for the next oversold condition or in case we are wrong, wait for the next breakout. I don’t expect a breakout anytime soon. The indices look weak and TheDailyGold Top 15 Index (15 of our favorite companies) also appears to have downside potential in the coming days and weeks. Nevertheless, I am actively researching companies as well as watching their price action. The coming months could be your last best chance to accumulate the companies poised to benefit from the coming revival in precious metals.


