Get 40% Off
These stocks are up over 10% post earnings. Did you spot the buying opportunity? Our AI did.Read how

Precious Metals Grind Lower To June Targets

Published 05/26/2016, 06:10 PM
Updated 07/09/2023, 06:31 AM

Prices are moving three steps lower and two steps back toward the June targets. I expect this to continue for a few more weeks, and then the final drop to a 6-month low should be relatively sharp finishing this intermediate term decline. I'd like to see a few more trading days, but I'm contemplating lowering the target areas slightly for both gold and silver.

US DOLLAR - Dollar prices are digesting the recent gains, as long as prices don't close below the dashed line and the 10-day moving average for two or more days the trend is higher.
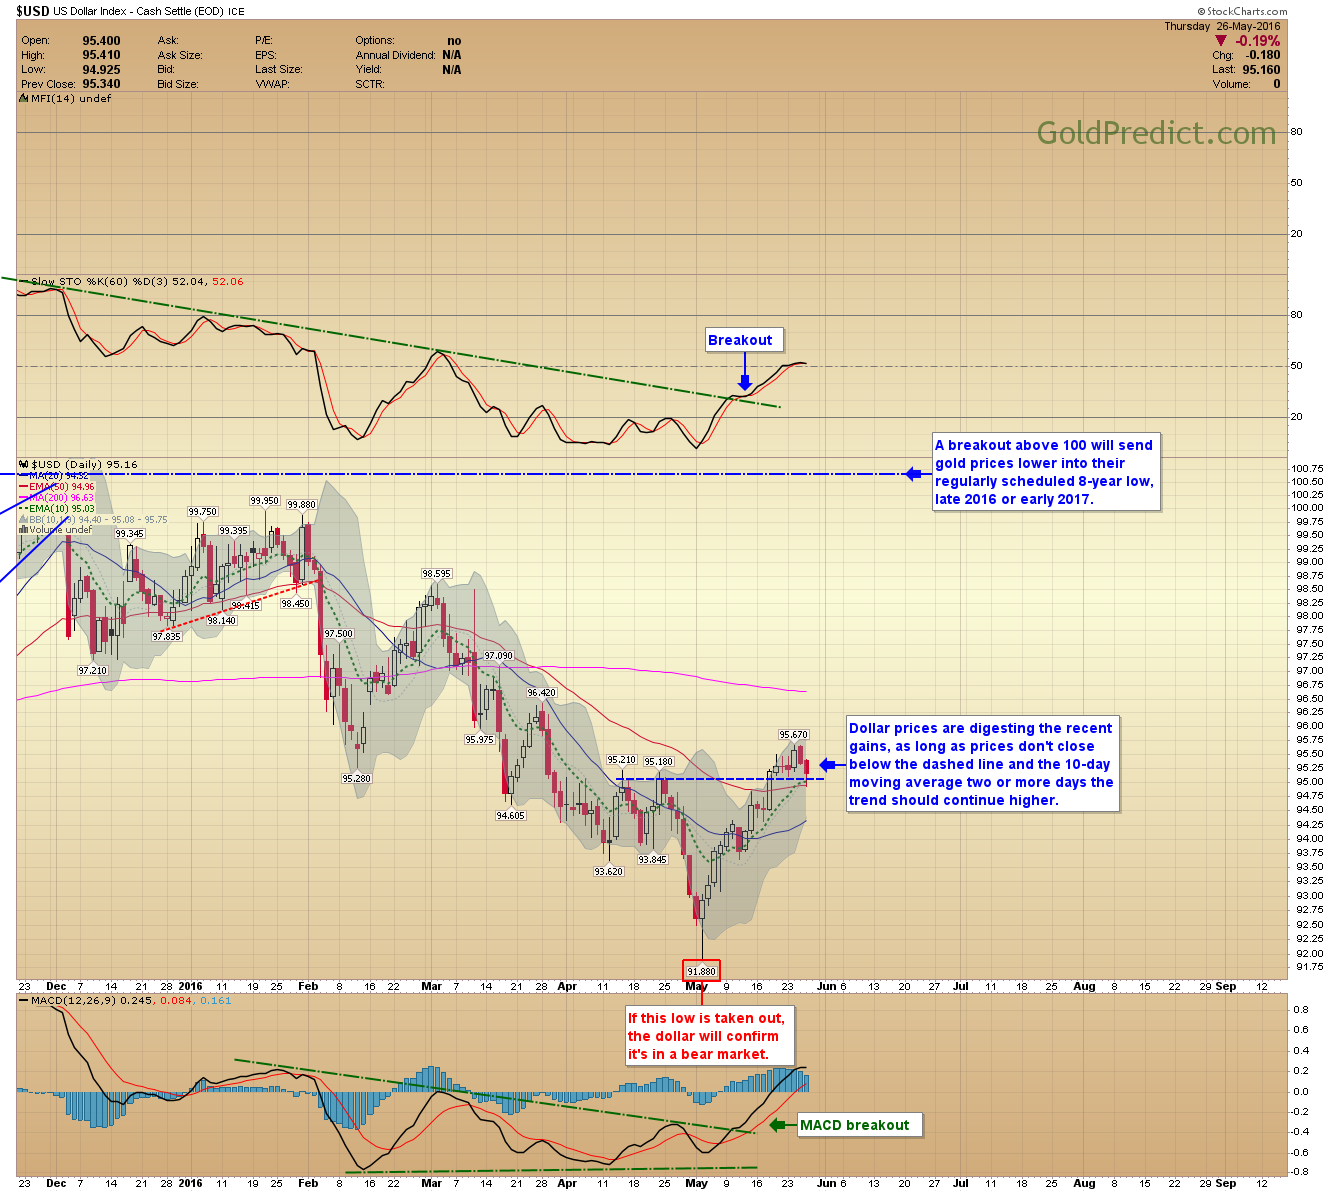
USD Daily Chart

GOLD - Prices attempted to rally, and sellers came in to push them back down into the close: a common occurrence when dropping to a 6-month low. MFI readings should drop below 20 before a bottom arrives.
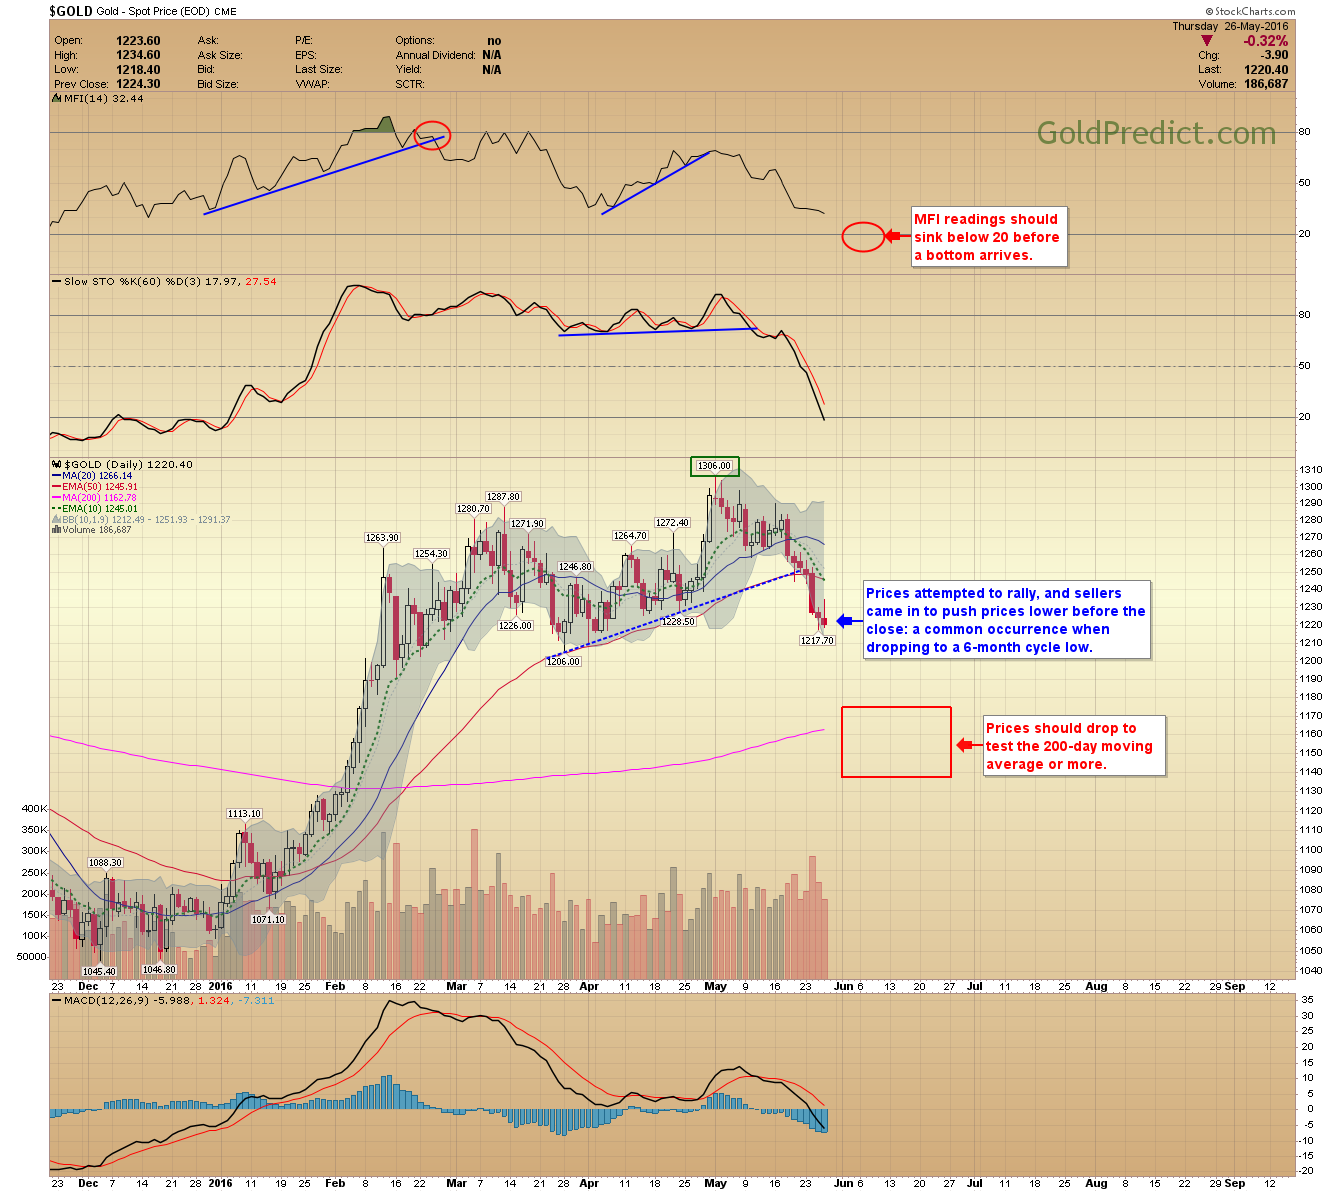
Gold Daily Chart

SILVER - Prices rallied to touch the 10-day MA and promptly soldoff to the opening bid. I may lower the target box slightly to include the $14.60-$14.80 support level.
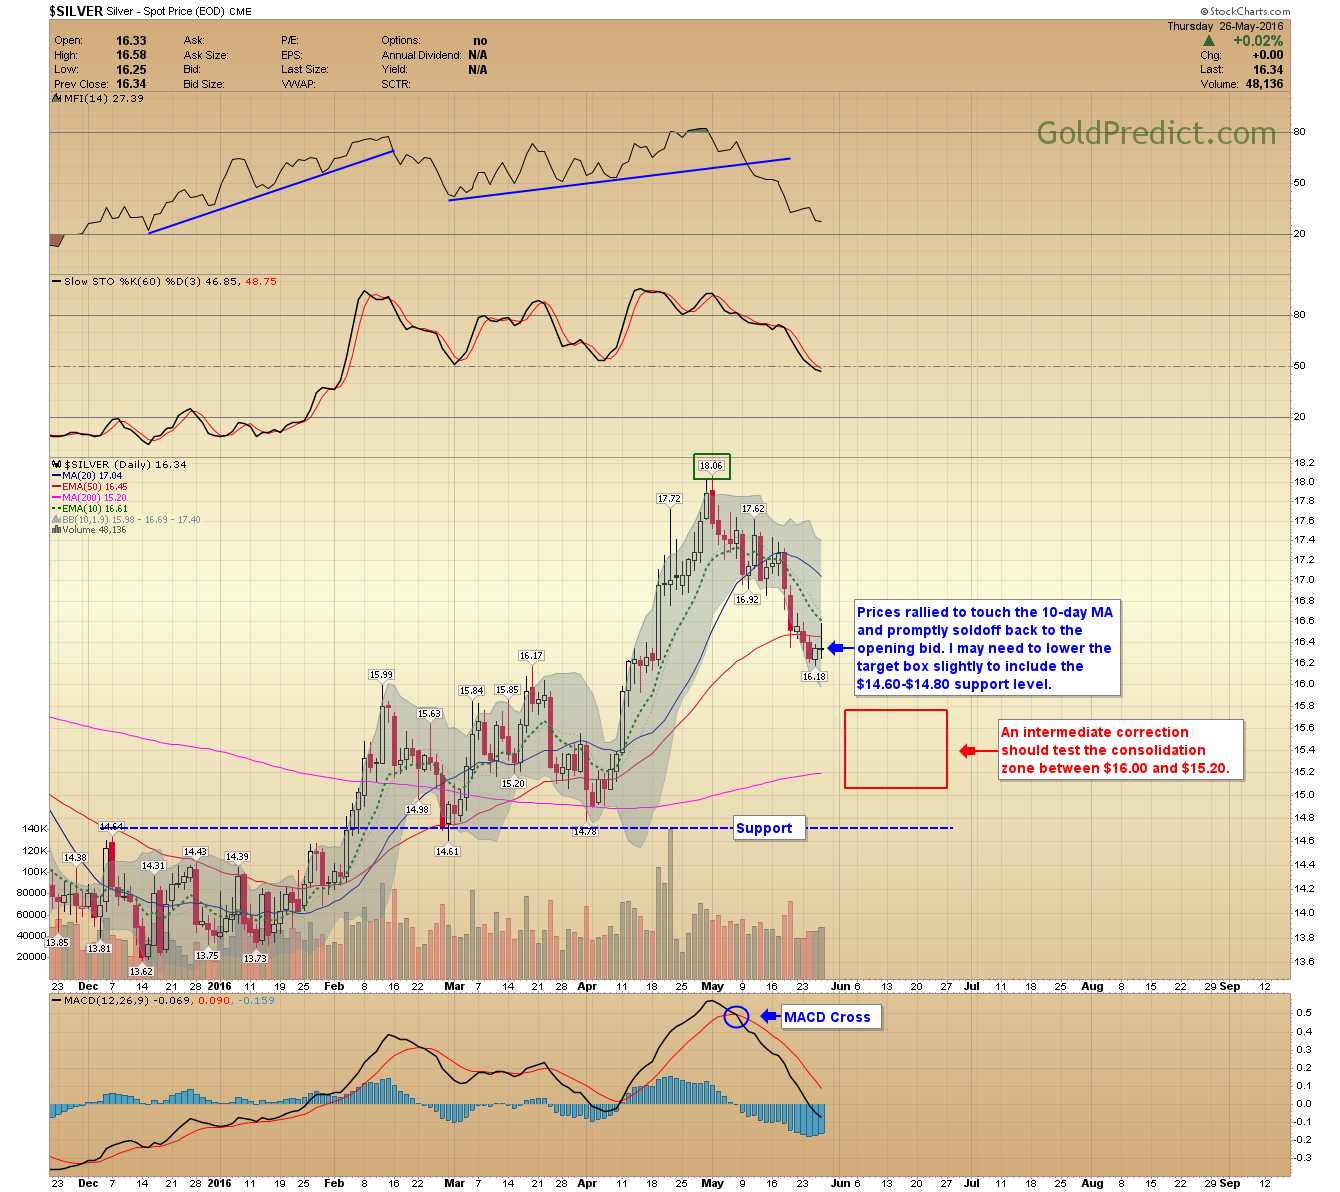
Silver Daily Chart

VanEck Vectors Gold Miners (NYSE:GDX) - Prices touched the 10-day MA but were unable to sustain a close above the $23.34 resistance level, prices should continue lower from here.
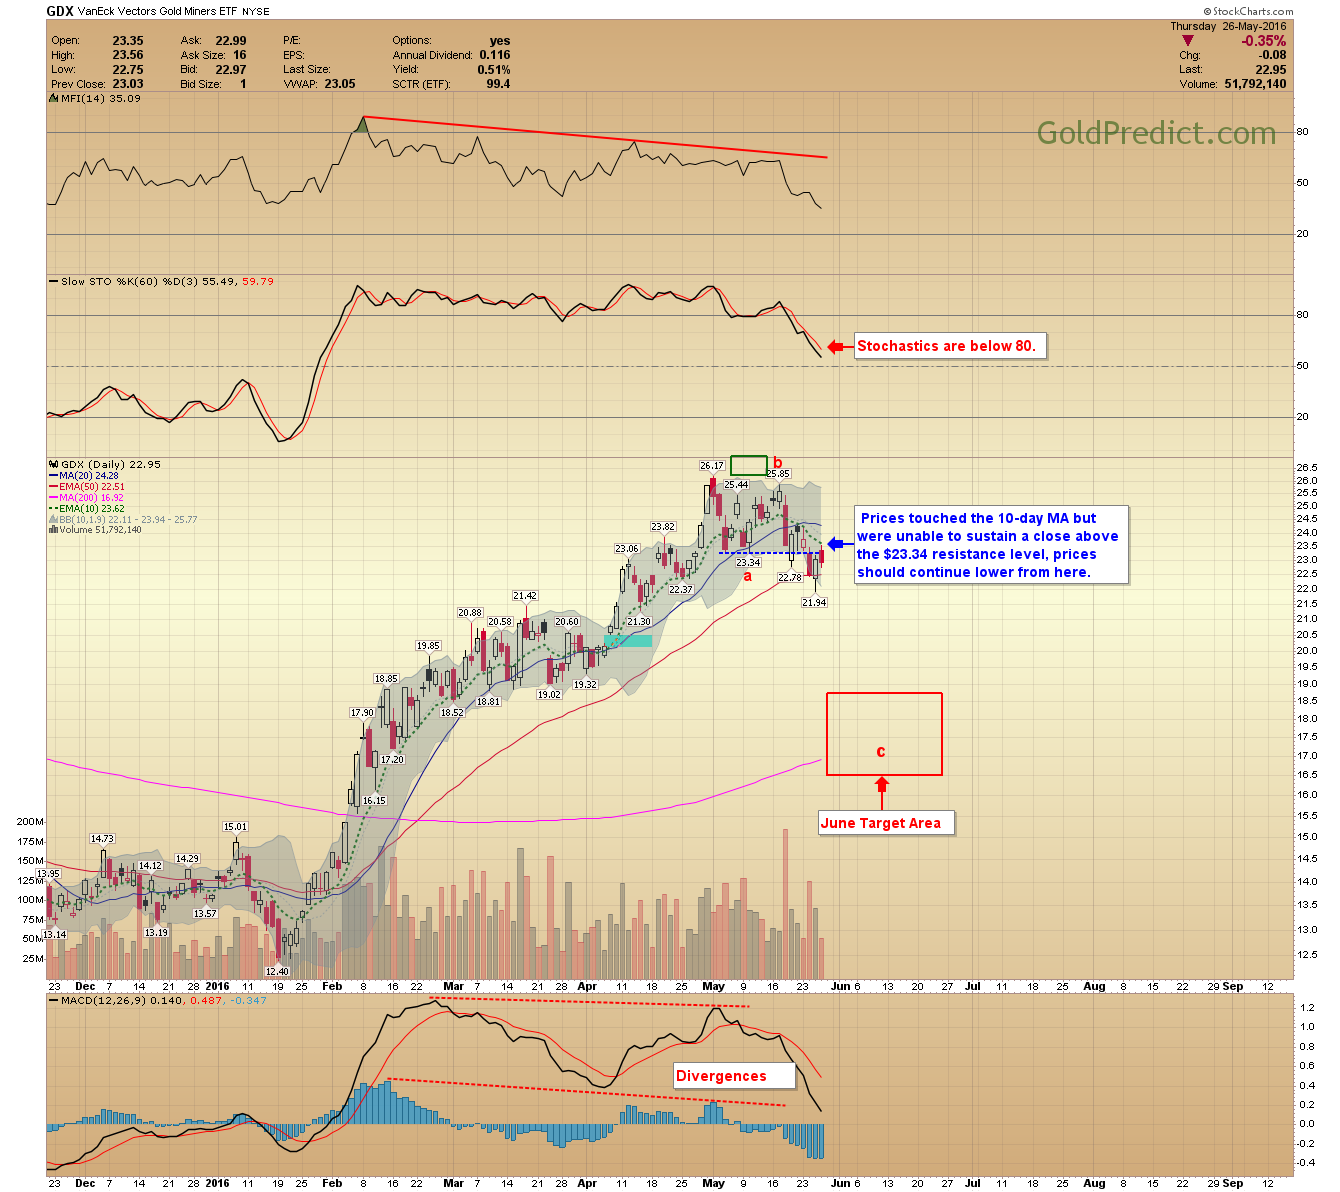
GDX Daily Chart

VanEck Vectors Junior Gold Miners (NYSE:GDXJ) - Prices closed right at the blue resistance level and the next area of support comes in at the $29.00 level.
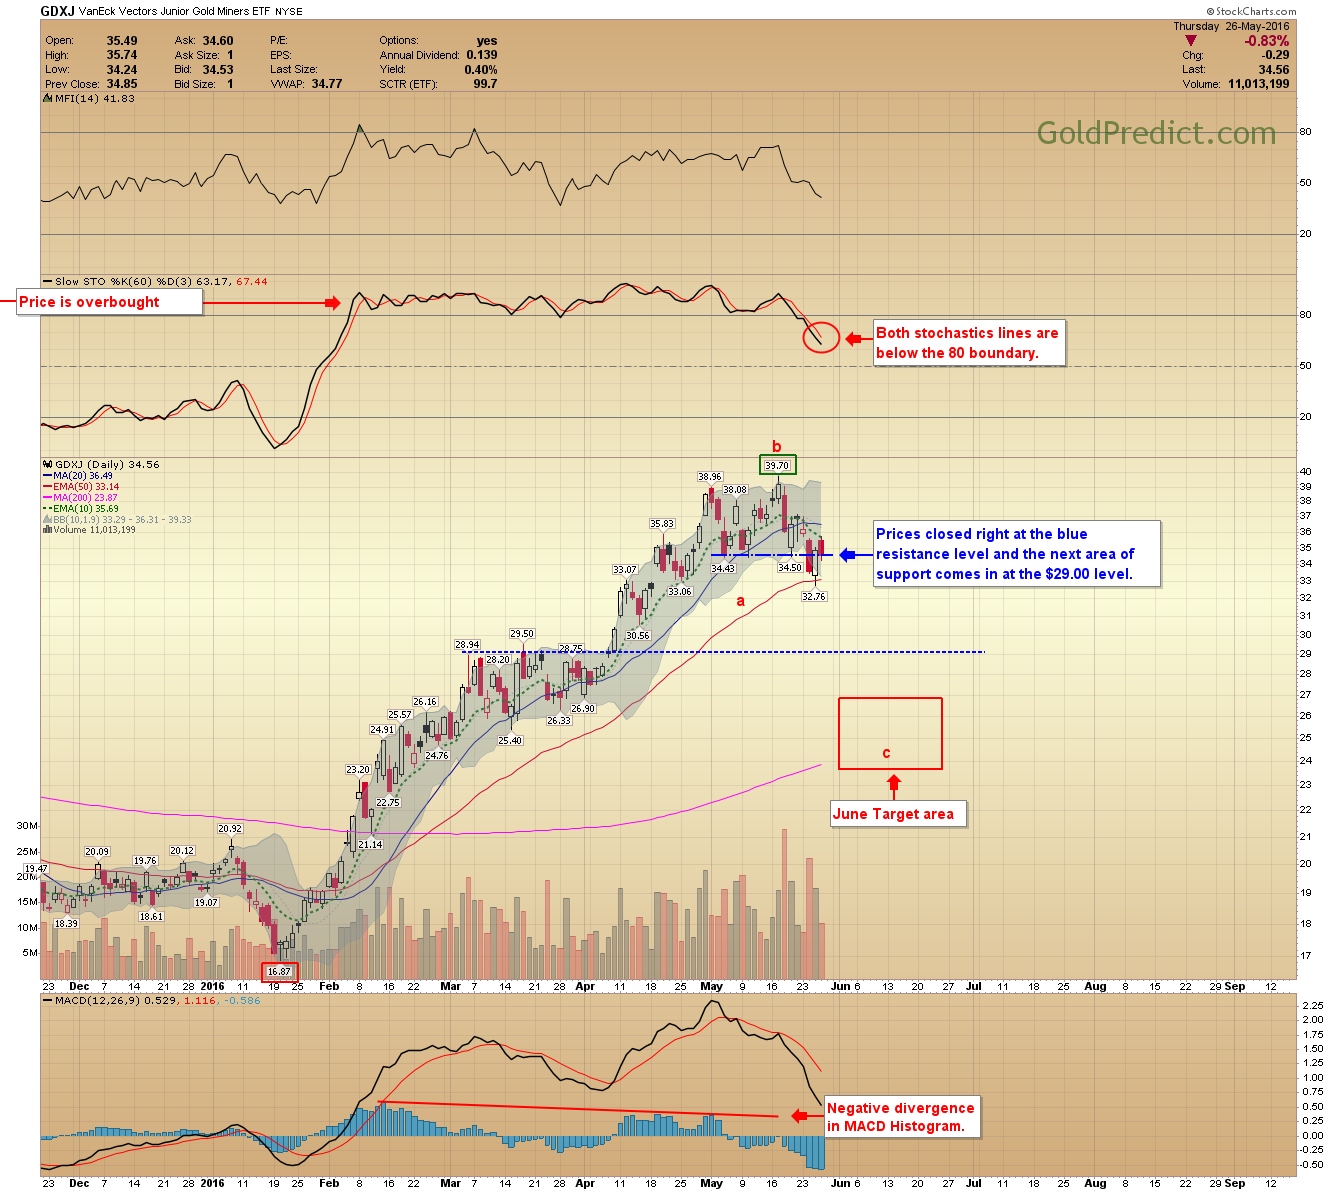
GDXJ Daily Chart

SPDR S&P 500 (NYSE:SPY) - My overall outlook includes fresh all-time highs in US stock markets this year and the potential for a significant top as well. Many of the leading economic indicators I'm watching are hinting of a possible recession starting in 2017. Nevertheless, I think the Fed is helping prices higher before a June rate hike. Volume the last two weeks has been terrible.
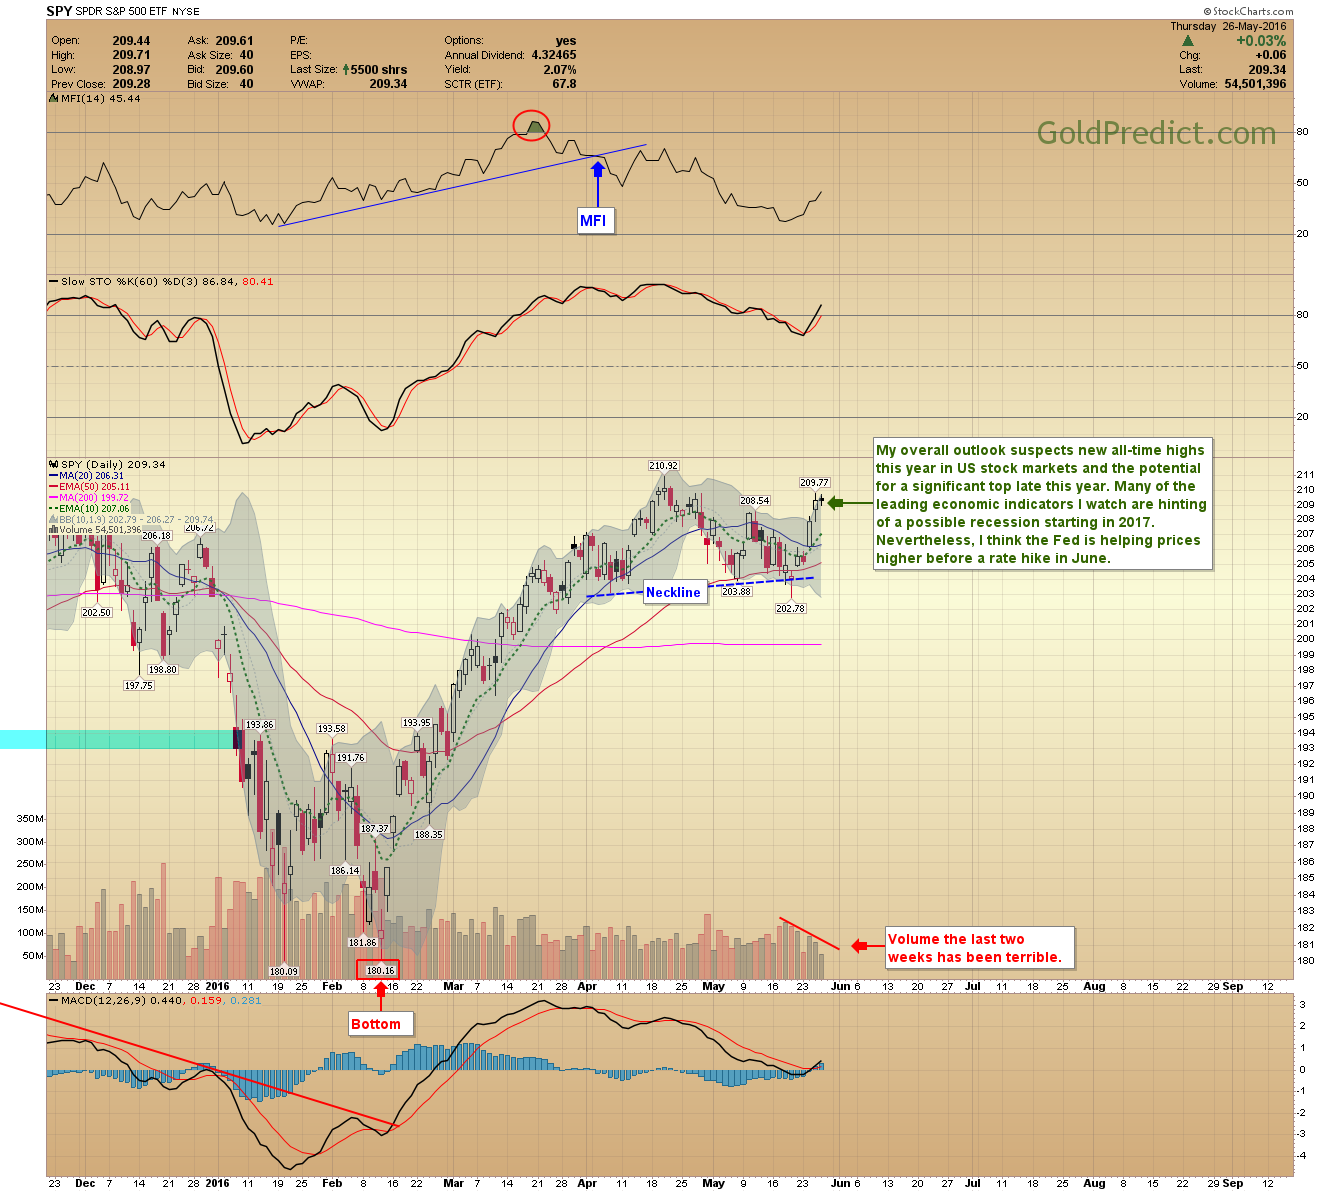
SPY Daily Chart

3rd party Ad. Not an offer or recommendation by Investing.com. See disclosure here or remove ads .

Apple Inc (NASDAQ:AAPL) - Apple never broke down (closed) below the critical $90.00 support level, and prices are rallying back to the Island gap around $103 before they turn back lower.
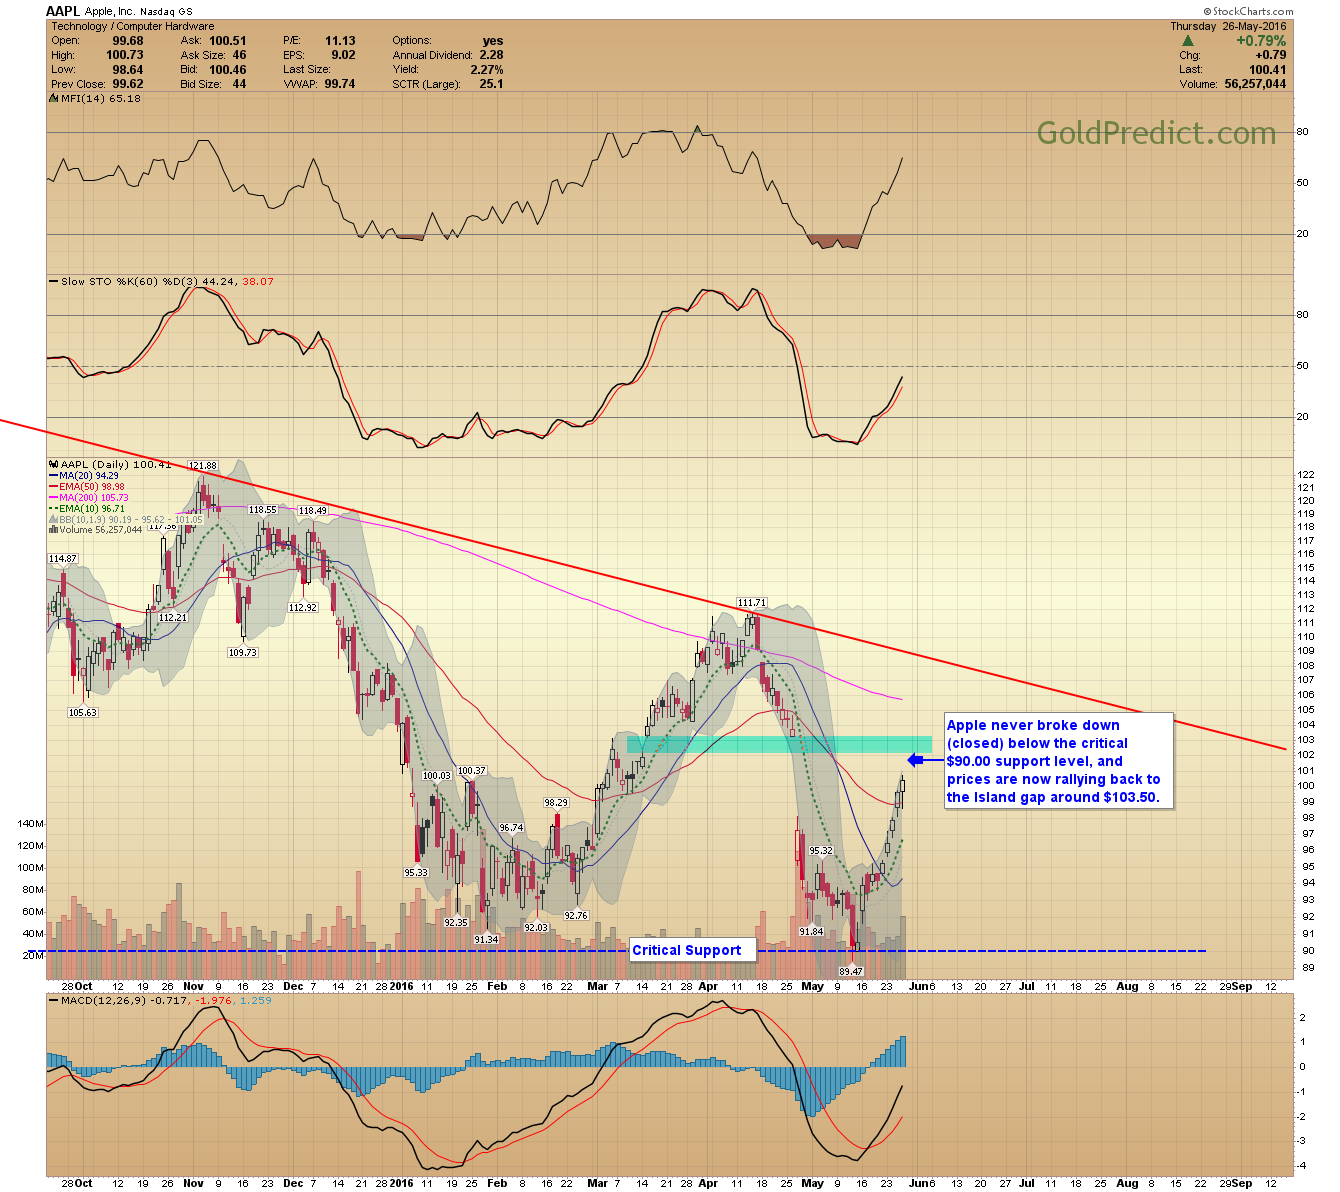
Apple Daily Chart

WTIC - Prices appear to be forming an ending diagonal pattern, these often finish with a swift/sharp decline lower upon completion. MFI (above) looks anemic.
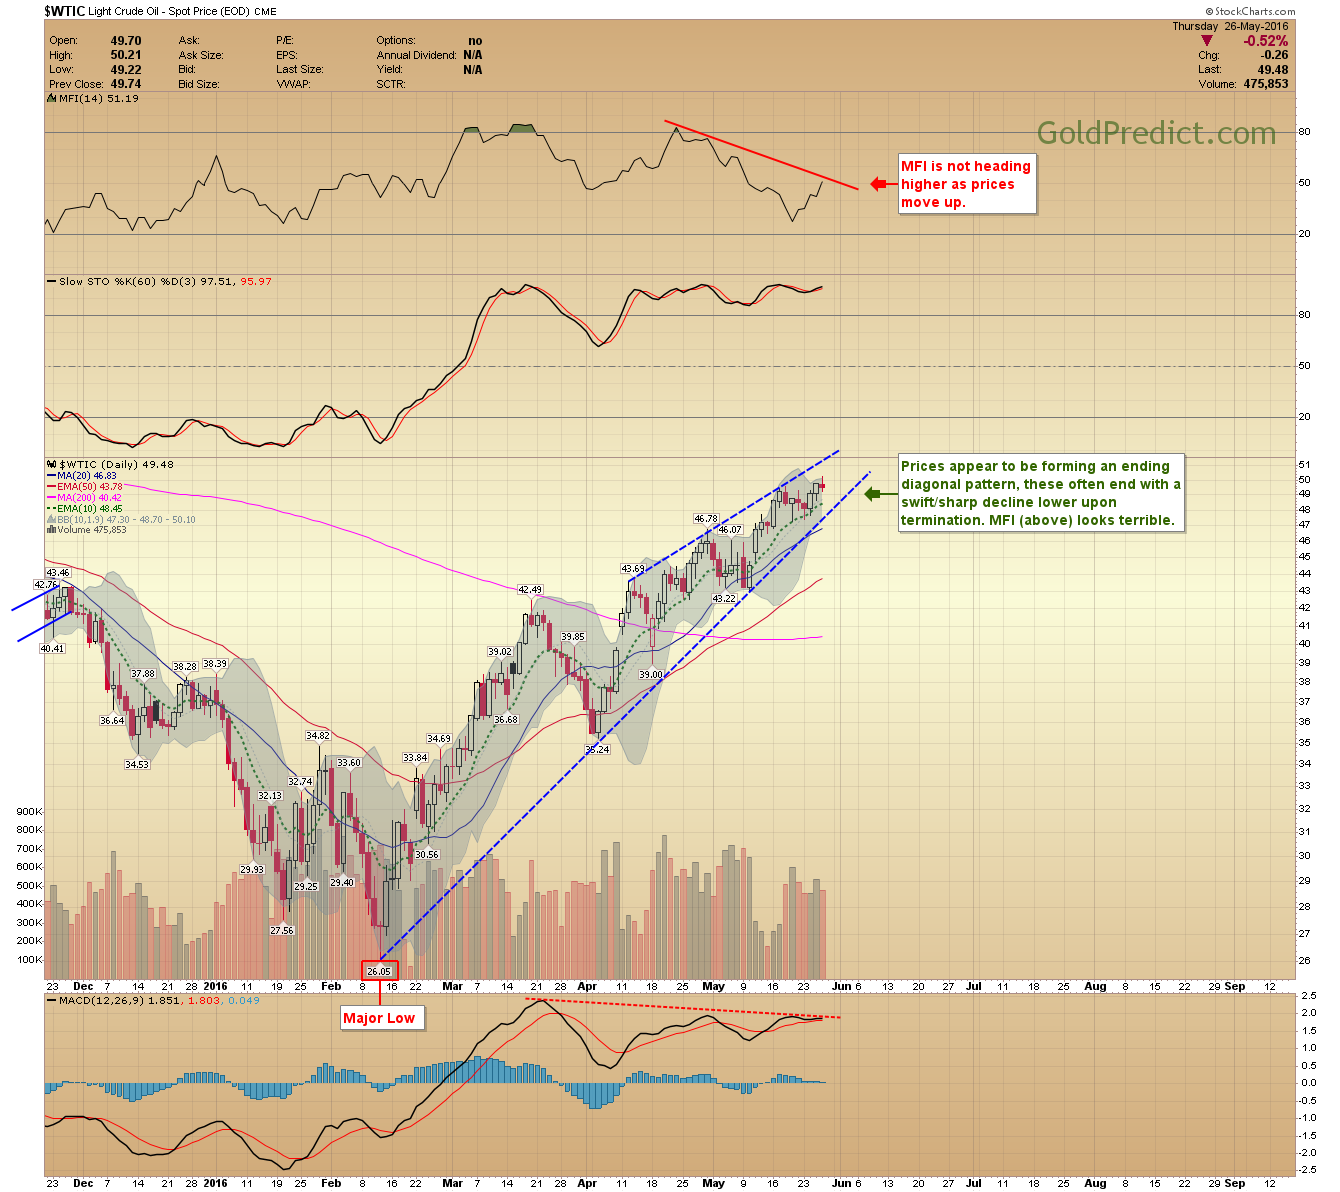
WTIC Daily Chart

The GDP revision will be out at 8:30 AM tomorrow and that could move markets if there is considerable improvement. Have a wonderful weekend!

Latest comments

Risk Disclosure: Trading in financial instruments and/or cryptocurrencies involves high risks including the risk of losing some, or all, of your investment amount, and may not be suitable for all investors. Prices of cryptocurrencies are extremely volatile and may be affected by external factors such as financial, regulatory or political events. Trading on margin increases the financial risks.
Before deciding to trade in financial instrument or cryptocurrencies you should be fully informed of the risks and costs associated with trading the financial markets, carefully consider your investment objectives, level of experience, and risk appetite, and seek professional advice where needed.
Fusion Media would like to remind you that the data contained in this website is not necessarily real-time nor accurate. The data and prices on the website are not necessarily provided by any market or exchange, but may be provided by market makers, and so prices may not be accurate and may differ from the actual price at any given market, meaning prices are indicative and not appropriate for trading purposes. Fusion Media and any provider of the data contained in this website will not accept liability for any loss or damage as a result of your trading, or your reliance on the information contained within this website.
It is prohibited to use, store, reproduce, display, modify, transmit or distribute the data contained in this website without the explicit prior written permission of Fusion Media and/or the data provider. All intellectual property rights are reserved by the providers and/or the exchange providing the data contained in this website.
Fusion Media may be compensated by the advertisers that appear on the website, based on your interaction with the advertisements or advertisers.
© 2007-2024 - Fusion Media Limited. All Rights Reserved.