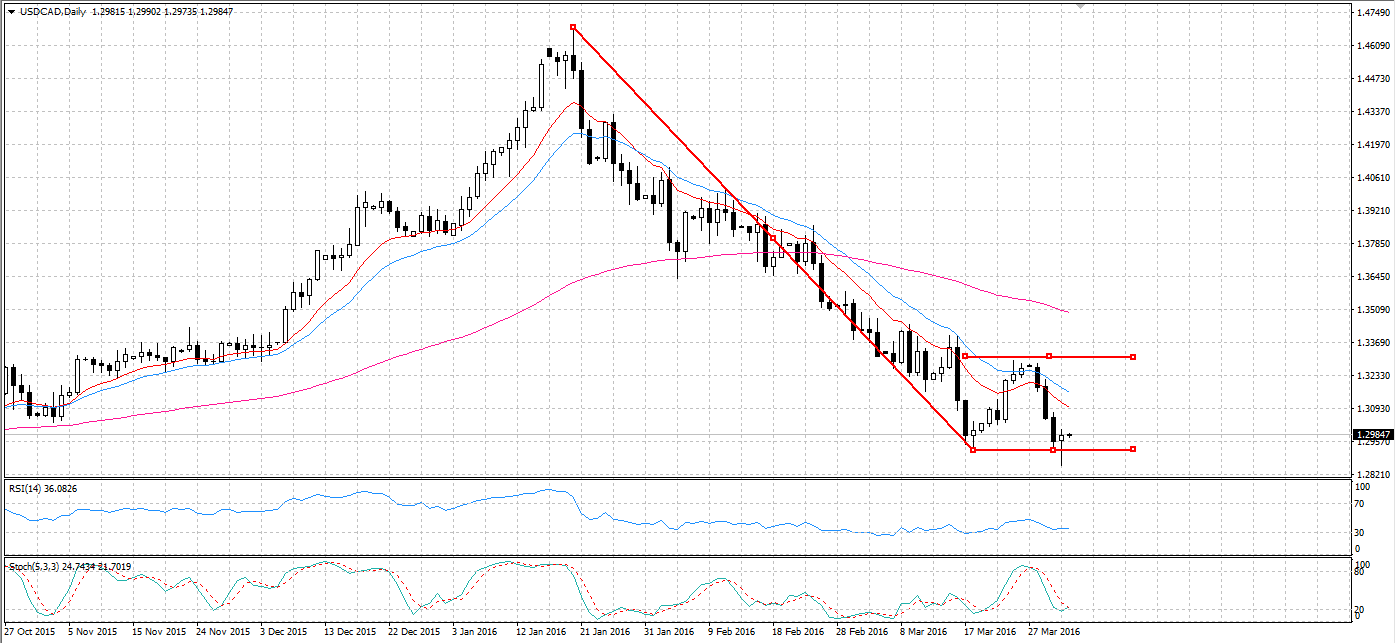
After posting continuous losses over the past few of months, the loonie may finally have some upside potential. While I don’t think anyone expects the pair to erase the epic plunge which started in January, a bearish rectangle may see the USD claim back some ground in the short term. Looking at the technicals reveals a number of compelling reasons to expect a decent rally for the pair, in spite of the spate of recent US economic indicator disappointments.
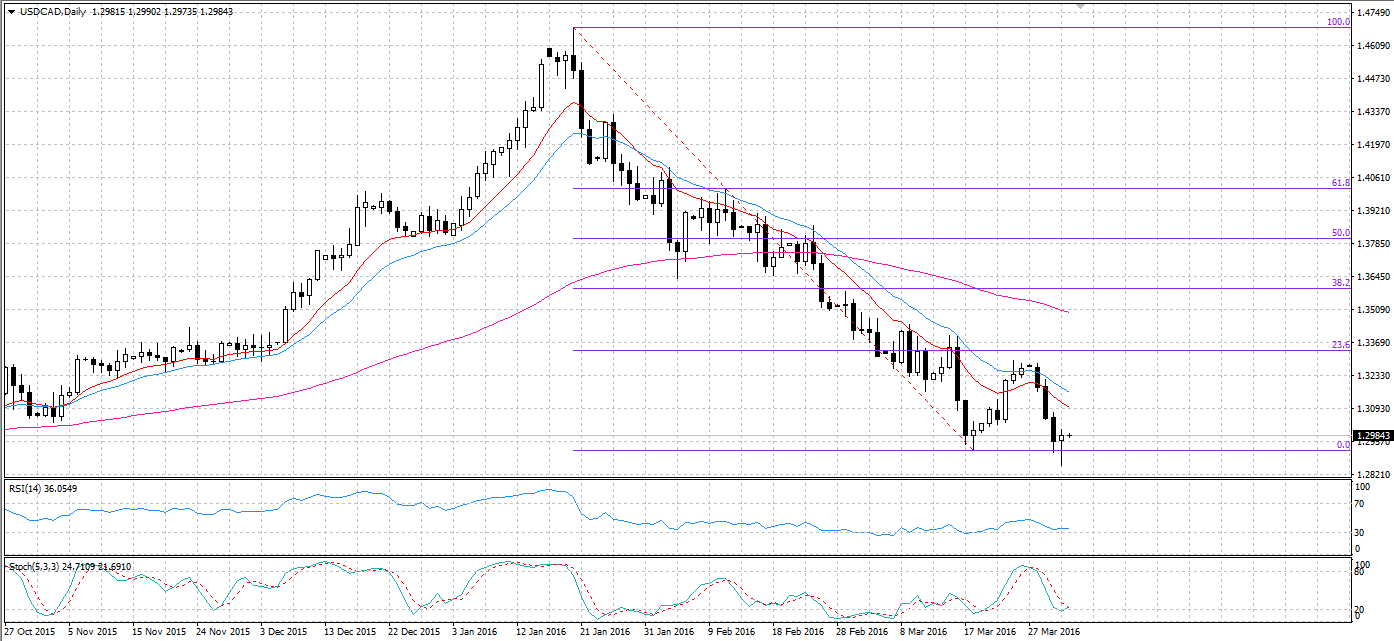
A cursory glance at the daily chart may at first appear to show the recent trend continuing within a bearish channel. Whilst there is definitely a high probability for a continuation pattern, the evidence points to a wide bearish rectangle and not a simple channel. The Fibonacci retracement demonstrates that the loonie currently ranges within two retracements levels. Specifically, the pair ranges between the 23.6% resistance and 0.0% support zones at 1.3338, and 1.2921, respectively.

Subsequently, the loonie should be moving towards the 23.6% retracement level at least once more in order to complete the rectangular pattern. The latest chart data appears to support this movement for the pair as the last two daily candles are already beginning to climb higher. Furthermore, both Stochastic and RSI oscillators are signalling the pair is oversold or close to it. Subsequently, becoming oversold generates additional buying pressure to buoy the loonie and test the 1.3338 zone of resistance once again.
In addition to the technicals, the fundamentals will assist in bringing the rectangle pattern to completion. With an expected non-farm payrolls result of 205K and a positive change to the Michigan consumer sentiment index up to 90.5, the USD should claw back some of the recent losses. On the back of the decent ADP non-farm payrolls result of 200K, it’s reasonable to expect the Bureau of Labour Statistics figures to also come in relatively favourably. Posting another solid result will go a long way in generating the requisite momentum to test the 23.6% zone of resistance. However, it is important to be aware of the divergence that occasionally occurs between the ADP and Bureau of Labour Statistics non-farm payroll results.
As a bearish rectangle is usually indicative of an eventual downside breakout, the pair cannot stay at or above the 1.3338 resistance for an extended period of time. With this chart pattern, a subsequent fall back to support is highly likely after testing resistance. As a result, keep a close eye on the pair as it draws closer to the zone of resistance to avoid being caught off guard by a reversal.

Ultimately, the loonie is likely to continue its downward slide until such a time that the US can show some real economic improvement. However, the short term may provide some respectable upside movement as the pair tests the rectangle it now finds itself in.
