A bevy of our best studies are pointing to more positive levels for Gold. We'll unfold 'em herein, but let's again begin with that topic which is hot, (or arguably not): the stock market.
A mere 19 trading days ago, the S&P 500 was happily splashing about in the warm waters of complacency within Ms. Marché's womb, basking in the glow of the 2000s. Then this past Wednesday the Index came within 21 points of the 1700s, on an intra-day basis marking a 9.835% correction from the S&P's all-time high (of 2019.26 on 19 September down to 1820.66 on 15 October). In fact, on a closing level basis, the S&P has thus far corrected but a mere 7.401% ... and yet with my own ears, I've heard this referred to as a "crash". Complacency's skin thus appears thin.
Public perception aside, things can change quickly, non? Contextually, the S&P's finally having sold off at least this little bit really ought not be startling a wit. For, dare I say, to wit: on Thursday morning, I ran into an Investors Roundtable friend who quipped that amongst our noble group of prescient market players, there may be some unease, to which I replied "This is nothing". We then both agreed that a correction of 50% would be more of an eye-opener, and that moreover, the S&P year-to-date is still up, indeed +2% per yesterday's (Friday's) close at 1886.76.
Far be it from me to formally predict a stock market correction as vast as 50%; 'tis akin in accuracy to predicting the outcome of a baseball game. But were such correction to occur, I'd honestly not be surprised and would take it in stride, for 'twould be a re-calibrating of getting price back into sync with earnings. Surprising would be the Federal Reserve Bank's not stepping in with some sort of a Quantitative Easing Part Cinq to keep it from all going wrong.
Still, both home and abroad, concerns over "geo-jitters" have morphed into "econ-jitters". Oh the bad stuff going on 'round the globe has, if anything, intensified. If it begins with a vowel, (i.e. Ukraine, ISIS, Ebola), 'tis bad. But when it comes to one's own worth, priories swiftly switch from liberal cares about the world to conservative cares about the wallet, the invested majority of which are a bit lighter than they were just a month ago. And yet, ought we not all understand 'tis the seasonal selling of stocks? Away with such worry! Why the Fed's "tan tome" that was issued mid-week finds moderate growth nationwide, fueled by consumer spending along with increases in commercial construction and manufacturing. Who needs more QE, eh? Good thing it finally fizzles out this month!
'Course, that was all compiled prior to the just reported decline in retail sales, drops in both the NY State Empire Index and Philly Fed reading, and now a marked pullback in the NAHB Housing Index. It does beg the question: Does anybody really know what's economically going on?
We herein saw a week ago that the Bond certainly knows. The yield on its 30-Year money is now back below 3% for the first time since 09 May 2013. Another entity "in the know" is an investment banking colleague of ours, who in a mid-week teleconference to clients put forth being on the watch for continued low interest rates, QE 5, and an eventual resurgence in the price of Gold. Perhaps our own Economic Barometer is knowledgeable as well. 'Twas just three weekly missives ago that we queried: "Is the end of QE going to appear as terribly timed?" As promised, to the Econ Baro we go:
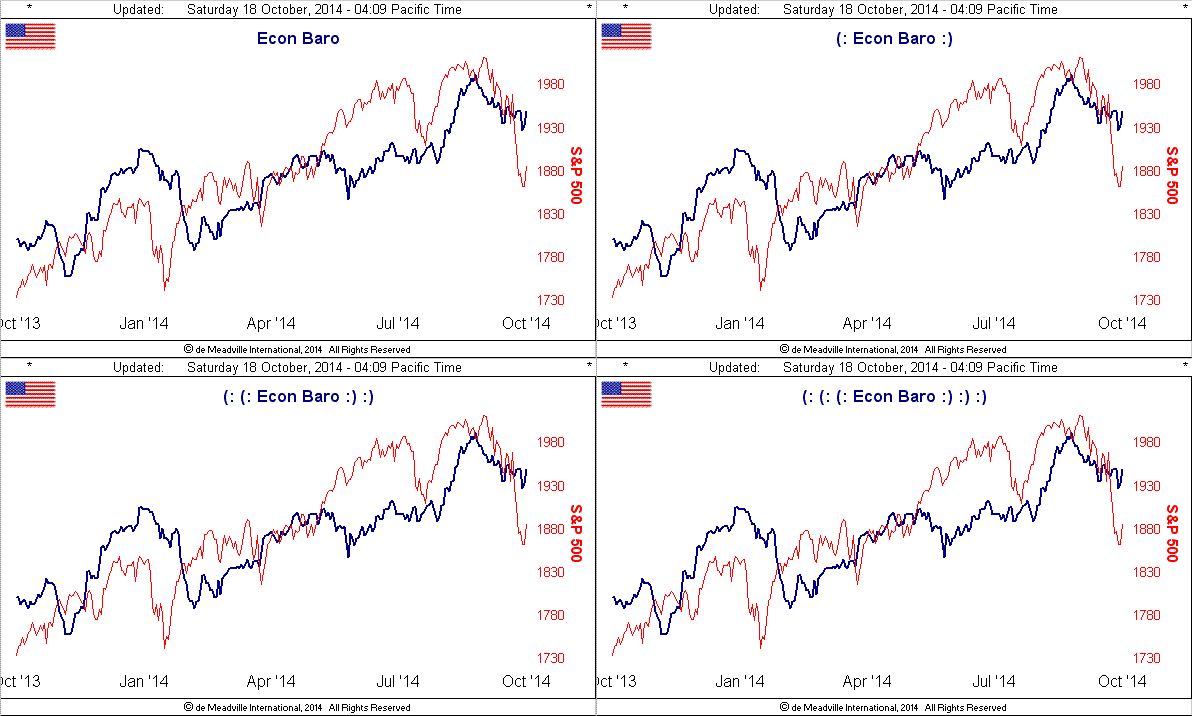
This current retreat by the Baro (blue line) does not appear atypical of prior pullbacks; that by the S&P (red line) rightly is more robust given its 7.401% "crash". But with the booster rockets of QE finally emptying their fuel cells, is there enough pure economic energy the keep the Baro and S&P aloft, or are they destined to go as does a glider in one of those old movie clips, wherein upon being released by its running supporters, then zooms through the air for a few meters before ending up in Farmer Fred's barn wall? Either way, with QE burning off, we ought give some consideration to renaming the "Econ Baro" to the "Show-Me Baro".
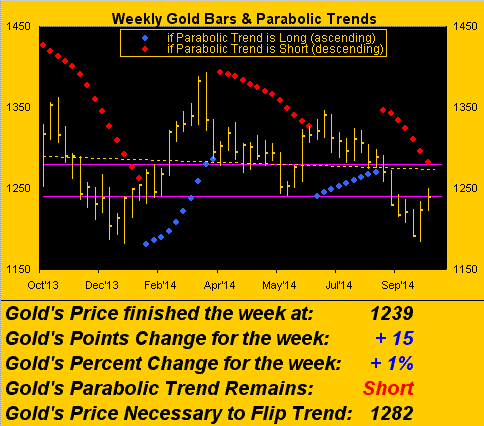
As for Gold, our friends in the FinMedia were really thrown askew as how to couch it throughout the week. I found this "chain" of what I'm now convinced have to be computerized headlines, rather than being written by humans, quite amusing: "Gold Trades Near 4-Week High as Investors Weigh Oil to Economy ... Gold Falls From 5-Week High as Sales Seen to Cover Other Losses ... Gold Is Near Five-Week High as Investors Weigh Stocks to Economy". They can throw it all up against Farmer Fred's barn wall and see how it pans out, or instead simply look to our chart of Gold's weekly bars and parabolic trends, wherein we can see what's really going on. And just as was suggested a week ago, Gold's positive pricing appears set for a meeting -- inside the purple-banded zone -- with the declining red dots of the parabolic Short trend. Upon such occurrence, by this study, the descending trend shall have come to an end. Given somewhat of an increase in seasonal volatility, we've calculated Gold's expected weekly trading range to now be 34.3 points; the next red dot in a week's time ought be in the 1260s; so mathematically, we're getting close to the end of this red dot run, barring an outright plummet by price in the ensuing week:
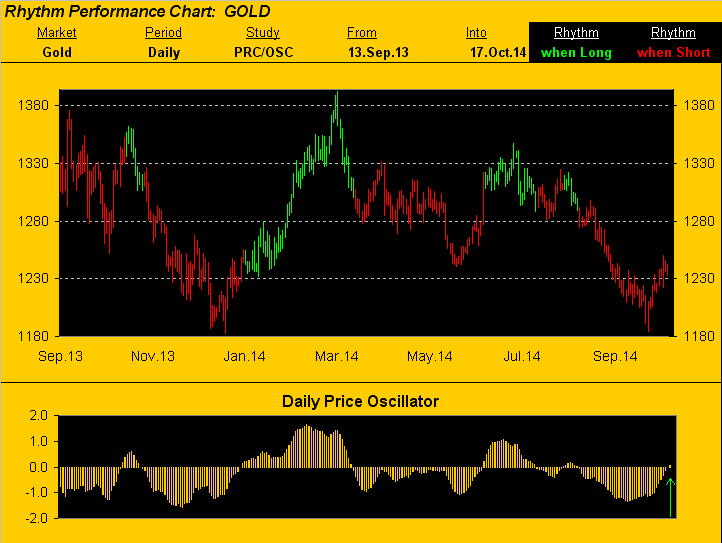
From the nearer-term trading perspective, here's some more positive Gold analysis. The best Market Rhythm we've found for Gold of late is derived from its Price Oscillator study, (daily bars). In the following two-panel chart of Gold from September 2013-to-date, look first at the lower panel: those are the Price Oscillator bars themselves, the rightmost one having just confirmed as positive at Friday's close. In the upper panel, Gold's daily bars, (which turn red following a negative oscillator confirmation), turn green following a positive oscillator confirmation. This means that Monday's price bar will be the beginning of a new green series. Because Gold has struggled to the Long side, with the exception of the January-to-March run earlier this year, the other green spates have not panned out very well. But for the record, the median price follow-through after a change in colour (per the oscillator's changing its "sign") has been 65 points for the nine signal changes across the following chart. The point is: were that median to be achieved for this fresh, new upside signal, Gold's current 1239 level + 65 points = 1304, just in case you're scoring at home:
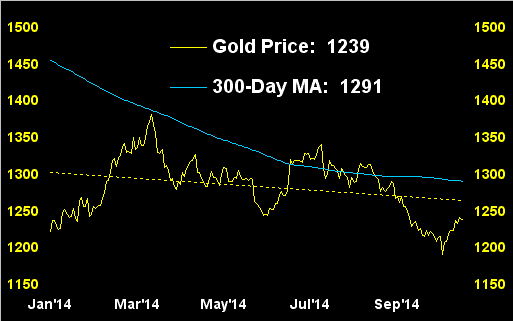
Here's yet another positive analytical take. Boffed recently again by its once ever-trusted 300-day moving average as a stalwart supporter for almost the entirety of a decade, here in this year-to-date chart we've price vis-à-vis that average. But in this case, the dashed linear regression trendline is the key, for price's distance below it appears to have run its typical course, such that now as to do same to the upside ought see Gold at least reach its 300-day moving average, the current 1291 level of which is not far from the median 1304 level just calculated above per the daily Price Oscillator's Market Rhythm study:
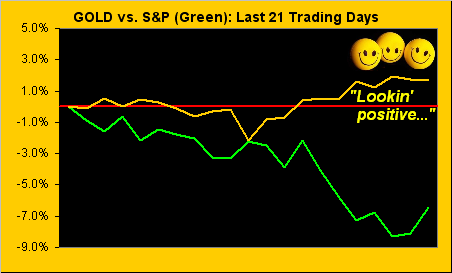
Further, should the S&P continue its swoon -- (bear in mind that in spite of the week's late recovery, we've yet to see the S&P put in a true 10% correction, which seasonally is ripe for the taking) -- things ought in turn continue looking positive for Gold. Here we've the percentage tracks of these two markets for the last 21 trading days (one month), the inverse correlation whilst starkly in Gold's favour, actually appearing a bit subdued relative to the S&P's own volatility:
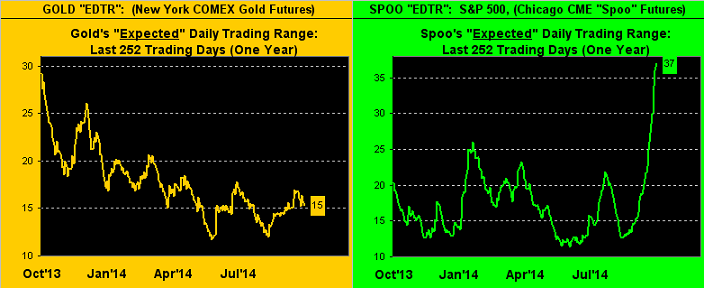
Indeed, irrespective of Gold's firming and turning more positive during the last two weeks, the ramp up in its own volatility pales notably compared to that for the S&P. Below we've the year-over-year expected daily trading ranges of the two markets, which at first blush infers there still to be little comparable excitement for Gold, (ah, but keep reading):
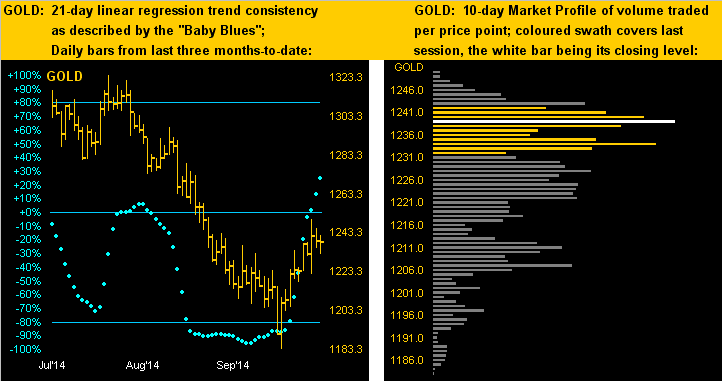
An apparent lack of excitement on the Gold side notwithstanding, 'tis perception of trend that brings folks through the trading doors. So let's show 'em that the 21-day linear regression trend has turned up for Gold, as in this next chart we look at the left-hand panel to see the "Baby Blues" having crossed into positive territory, this rally clearly having more strength than in the August attempt. Then in the right-hand panel of Gold's 10-day Market Profile, price's 1239 settle yesterday is smack on the most commonly-traded price of the last two weeks, which given that trading was only in that area for just the past three days is a testament to the large amount of volume moving through the Gold futures. In fact, Thursday alone sported the largest number of "front month" COMEX/GLOBEX contracts traded -- 258,099 -- since 01 July 2013 (309,347). So despite the somewhat crimped ranginess in Gold's price, excitement as expressed in volume, at full blush, is positively heating up:
"Don't forget India, mmb, they're doing some trend-setting too..."
Squire, you truly are moving well to the sharp end of the knowledge spectrum. Yes, 'tis been surmised within the reportage out there that India's "festive" importation of Gold rose by something on the order of 400% this past September versus that of 2013, the apparent rationale being that they can party more because Gold is cheaper, (September 2013's average price was 1348 vs. 1236 for this September, a -8% difference). How might Smokey Robinson and the Miracles put it: ![]() "Goa to a go-go"
"Goa to a go-go"![]() ?
?
In any event, to put it all in proper perspective, here is the present state of the Stack:
The Gold Stack:
Gold’s All-Time High: 1923 (06 September 2011)
The Gateway to 2000: 1900+
The Final Frontier: 1800-1900
The Northern Front: 1750-1800
On Maneuvers: 1579-1750
Structural Resistance: 1479 / 1524-1535
The Floor: 1466-1579
Le Sous-sol: Sub-1466
Year-to-Date High: 1392
Base Camp: 1377
The 300-day Moving Average: 1291
Neverland: The Whiny 1290s
The Weekly Parabolic Price to flip Long: 1282
10-Session directional range: up to 1250 from 1183 = +67 points or +6%
Resistance Band: 1240-1280
Trading Resistance: none
Gold Currently: 1239, (weighted-average trading range per day: 15 points)
Trading Support: 1234 / 1228-1222 / 1211-1207 / 1197
10-Session “volume-weighted” average price magnet: 1226
Year-to-Date Low: 1183
Structural Support: 1163 / 1145
As we roll out the door, let's consider for a moment iconic Rolls-Royce, its just having issued a profit warning for 2015. This is the company that makes those cylindric thingies that go under the wings of aircraft, thus providing the luft levels for your Lufthansa. The company, of course, also manufactures motor cars for the financially well-heeled enthusiast. But now, given the firm's concerns over the globally-slowing economy, is this long-revered engine/coachbuilding company on the verge of becoming a Phantom of its former self? (Sorry, I couldn't resist). "Fetch the keys, Cavendish, and take us on a jaunty spin for a buying spree over at the Gold vaults, won't you? Positively brilliant!"