It is well known that the VIX is negatively correlated with the S&P 500, opening up the possibility that a long S&P 500 position could be hedged with a long position in VIX futures. The data shows that a significantly improved return/volatility ratio could have been achieved by combining the two.
Using daily data for the S&P 500 and VIX for the period from 7 August '06 to current, we found a correlation coefficient of -0.66, confirming the strong negative correlation (a coefficient of -1 would indicate perfect negative correlation).
The annualized daily return over the period for the S&P 500 was 7.7%, with volatility of 21.1% to give a return/volatility ratio of 36%. The maximum drawdown was 74%. For the VIX, these metrics were 63% return, 115% volatility and 55% return/volatility, with maximum drawdown of 108%.
With 84% of the portfolio in S&P 500 and 16% in VIX futures, we have annualized daily return of 16.5%, volatility of 13.1% to give return/volatility of 126%. The maximum drawdown was 31%.
Therefore we find a significant improvement in portfolio return/risk from adding a component of VIX futures to a broad based US stock portfolio tracking the S&P 500.
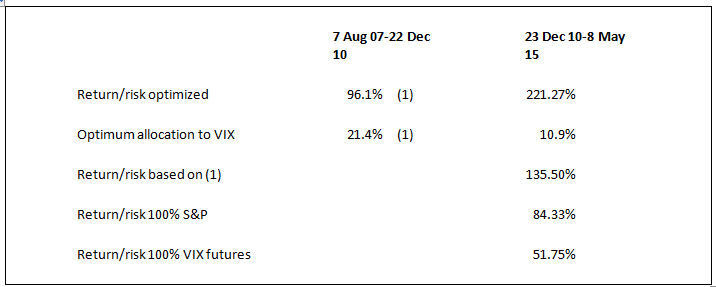
The 16% allocation to VIX was optimized (to maximize the return/risk ratio over the period from 7 August 2006). There is therefore some benefit of hindsight in these results. To test the effect of removing this, we split the historical period into two equal halves (7 August 06 -22 December 10 and 23 December 10-8 May 15), optimize the VIX allocation for the first half and view the results of using this in the second half. The table below provides the comparisons.

As would be expected, the results of using the allocation to VIX in the second half based on the optimized first half (135.5% return/risk) fall well short of the optimum for the second half found with the benefit of hindsight (221.27% return/risk).
However, the portfolio applied in the second half using the results from the first half (135.5% return/risk) outperformed by a large margin a portfolio allocated 100% to S&P 500 (84.33%) and 100% to VIX (51.75%). Therefore, the VIX allocation still added significant value, even at a suboptimum percentage.
Adding additional assets
We also analyzed the effect of adding gold, some currencies (spot USDCAD, spot EURGBP and dollar index futures), 10-Year T-bill futures and Nasdaq 100 futures to the S&P500/VIX portfolio. The results were as follows, for the period from 7 August 2006:

The 172.9% return/risk ratio for the portfolio is a significant uplift on the ratio for the S&P500/VIX portfolio of 126%, referred to above. It also provided a significant margin over the return/volatility ratio for any of the individual portfolio components. We thought a corporate bond portfolio (proxied by the Vanguard Total Bond Market Index - VBMFX) would be difficult to beat, but the 172.9% for the portfolio also exceeds the 118.1% for VBMFX by a significant margin.
Over the period from 7 August 2006 the maximum drawdown for the portfolio was 4.0% which was lower than the VBMFX maximum drawdown of 5.5%. Both compare favorably with the S&P500 drawdown of 74% noted above.
Our results are suggestive that risk can be significantly reduced by appropriate portfolio construction, in the process improving risk-adjusted returns.
