Get 40% Off
🎁 Free Gift Friday: Copy Legendary Investors' Portfolios in One ClickCopy for Free

Philly Fed Business Outlook Again Beats Forecast

Published 04/18/2014, 01:32 AM
Updated 07/09/2023, 06:31 AM

Note from Doug: Having lived for two wonderful years in Paoli, PA, a suburb west of Philadelphia just south of Valley Forge, I have a special interest in this regional indicator. But, more importantly, it gives a generally reliable clue as to direction of the broader Chicago Fed's National Activity Index.

The Philly Fed's Business Outlook Survey is a monthly report for the Third Federal Reserve District, covers eastern Pennsylvania, southern New Jersey, and Delaware. The latest gauge of General Activity came in at 16.6, an increase from last month's 9.0. The 3-month moving average came in at 6.4, up from 4.0 last month. Since this is a diffusion index, negative readings indicate contraction, positive ones indicate expansion. However, today's six-month outlook at 26.6 is the lowest in 12 months.

Here is the introduction from the Business Outlook Survey released today:

Manufacturing activity in the region increased in April, according to firms responding to this month’s Business Outlook Survey. The survey’s broadest indicators for general activity, new orders, shipments, and employment all remained positive and increased from their readings in March. Price pressures remain modest. The survey’s indicators of future activity reflected optimism about continued expansion over the next six months, although the indicators have fallen from higher readings in recent months. (Full PDF Report)

Today's 16.6 came in above the 10.0 forecast at Investing.com.

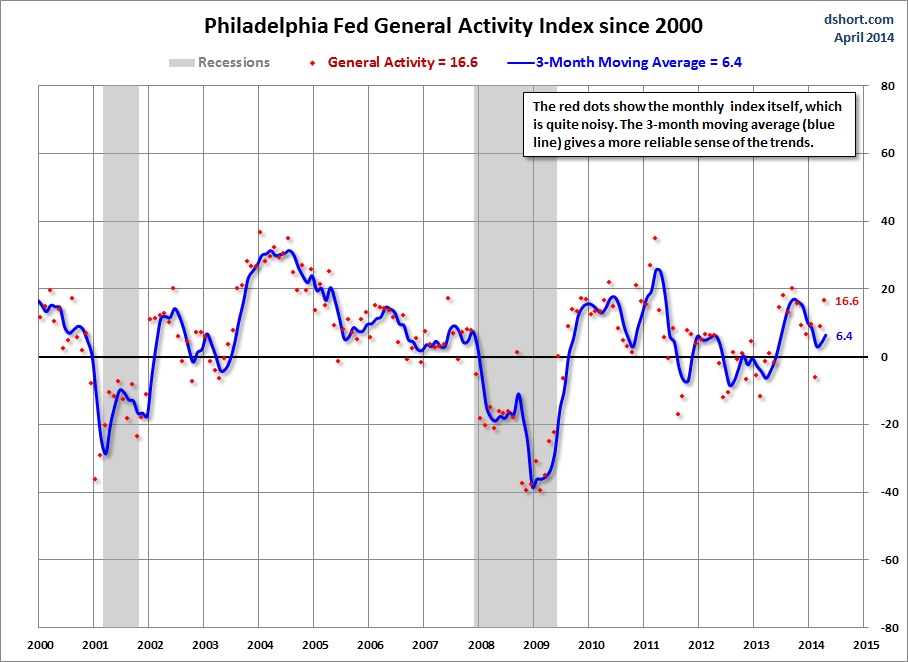
The first chart below gives us a look at this diffusion index since 2000, which shows us how it has behaved in proximity to the two 21st century recessions. The red dots show the indicator itself, which is quite noisy, and the 3-month moving average, which is more useful as an indicator of coincident economic activity. We can see periods of contraction in 2011 and 2012 and a shallower contraction in 2013. The indicator is now off its post-contraction peak in September of last year.
3rd party Ad. Not an offer or recommendation by Investing.com. See disclosure here or remove ads .
Philly-Fed-GAC-since-2000

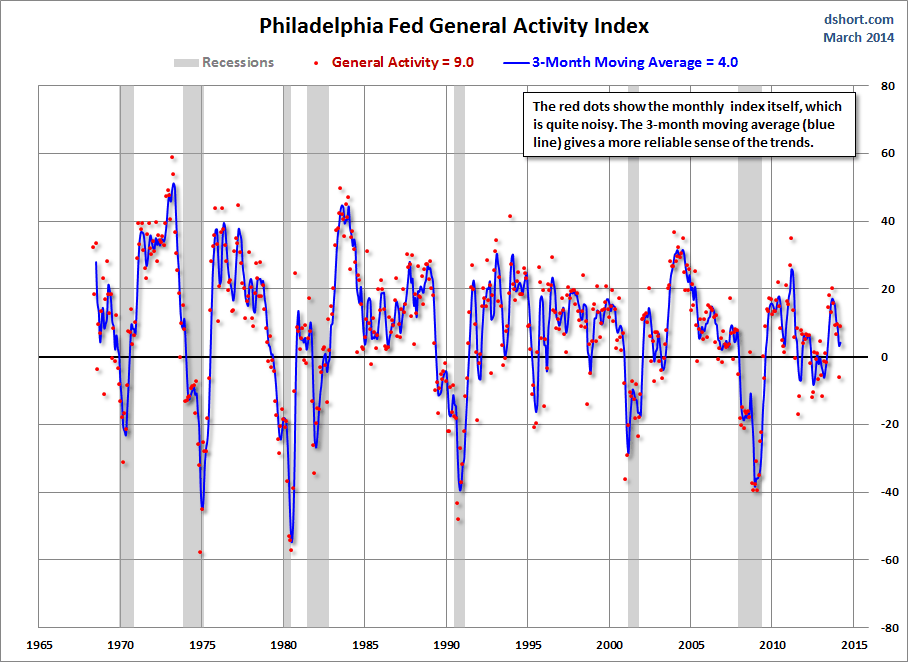
In the next chart we see the complete series, which dates from May 1960. The average absolute monthly change across this data series is 7.4, which shows that the 7.6 point change from last month is typical of the monthly volatility.
Philly-Fed-GAC-3-MA
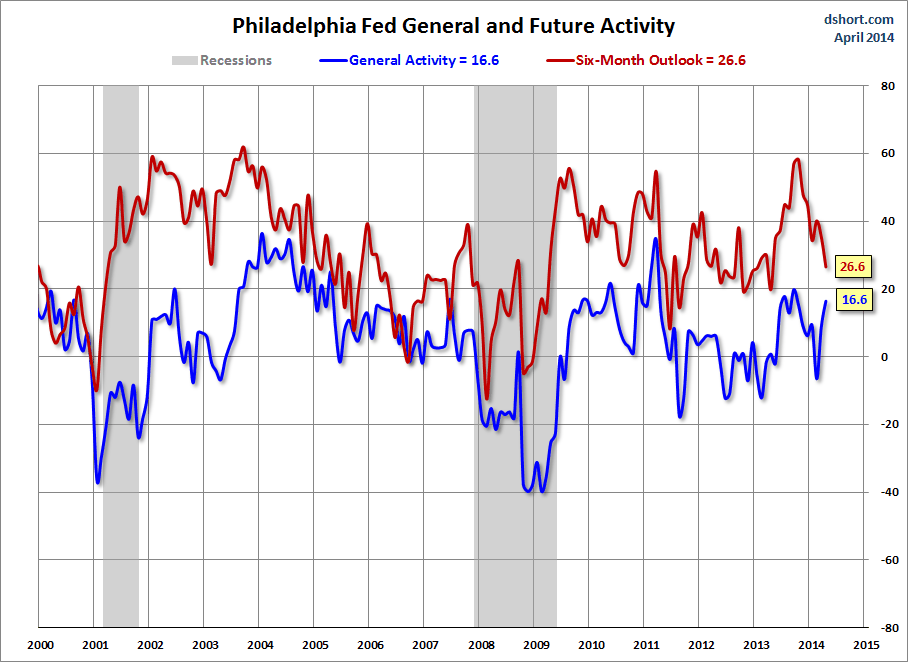
The next chart is an overlay starting in 2000 of the General Activity Index and the Future General Activity Index — the outlook six months ahead.
Philly-Fed-GAC-GAF

The Philly Fed General Activity Index continues to be a key indicator to watch closely.

Latest comments

Risk Disclosure: Trading in financial instruments and/or cryptocurrencies involves high risks including the risk of losing some, or all, of your investment amount, and may not be suitable for all investors. Prices of cryptocurrencies are extremely volatile and may be affected by external factors such as financial, regulatory or political events. Trading on margin increases the financial risks.
Before deciding to trade in financial instrument or cryptocurrencies you should be fully informed of the risks and costs associated with trading the financial markets, carefully consider your investment objectives, level of experience, and risk appetite, and seek professional advice where needed.
Fusion Media would like to remind you that the data contained in this website is not necessarily real-time nor accurate. The data and prices on the website are not necessarily provided by any market or exchange, but may be provided by market makers, and so prices may not be accurate and may differ from the actual price at any given market, meaning prices are indicative and not appropriate for trading purposes. Fusion Media and any provider of the data contained in this website will not accept liability for any loss or damage as a result of your trading, or your reliance on the information contained within this website.
It is prohibited to use, store, reproduce, display, modify, transmit or distribute the data contained in this website without the explicit prior written permission of Fusion Media and/or the data provider. All intellectual property rights are reserved by the providers and/or the exchange providing the data contained in this website.
Fusion Media may be compensated by the advertisers that appear on the website, based on your interaction with the advertisements or advertisers.
© 2007-2024 - Fusion Media Limited. All Rights Reserved.