
Chinese energy giant PetroChina Co. Ltd. (NYSE:PTR) announced first-half 2019 earnings of RMB 28.4 billion or RMB 0.155 per diluted share compared with RMB 27.4 billion or RMB 0.150 per diluted share a year earlier.
One of China’s big three oil giants, the other two being Sinopec (NYSE:SNP) and CNOOC Limited (NYSE:CEO) , PetroChina’s total revenue for the half year rose 6.8% from the year-ago period to RMB 1,196.3 billion.
The positive comparisons can be primarily attributable to higher oil and gas production and drop in lifting costs, which helped its exploration and production unit profit surge 79.4%. This was partly offset by weaker downstream earnings.
PetroChina Company Limited Price, Consensus and EPS Surprise
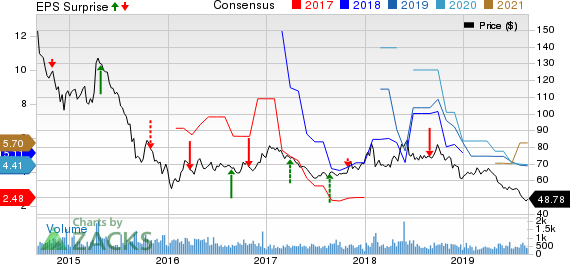
PetroChina Company Limited price-consensus-eps-surprise-chart | PetroChina Company Limited Quote
Segment Performance
Upstream: PetroChina posted higher upstream output during the six months ended Jun 30, 2019. Crude oil volumes – accounting for 58% of the total – rose 3.2% from the year-ago period to 451.9 million barrels. Marketable natural gas output was up by 9.7% to 1,964.3 billion cubic feet. As a result, PetroChina’s total production of oil and natural gas increased 5.9% year over year to 779.4 million barrels of oil equivalent.
This buoyed upstream (or exploration & production) segment operating income to RMB 53.6 billion compared to the year-ago profit of RMB 29.9 billion. A tight leash on oil and gas lifting costs that decreased 2,4% from the same period last year, also helped results. This was partly offset by drop in commodity prices. Average realized crude oil price during the first half of 2019 was $62.85 per barrel, 4.5% lower than the year-ago period.
Downstream: The Beijing-based company’s ‘Refining & Chemicals’ business generated an operating income of RMB 5 billion. This is down 80% from the year-earlier period earnings of RMB 24.7 billion. The plunge in the downstream division was due to higher operating expense, narrowing profit margin and lower chemicals prices.
PetroChina’s refinery division processed 597.4 MMBbl of crude oil during the six-month period, up 3.1% from 2018. The company produced 4,845 thousand tons of synthetic resin in the period (a rise of 8.8% year over year), besides manufacturing 2,983 thousand tons of ethylene (up 11.8%). It also produced 56,716 thousand tons of gasoline, diesel and kerosene during the period against 54,384 thousand tons a year earlier.
Natural Gas & Pipelines: Higher sales price and volume of domestic natural gas, together with expansion of sales terminals, helped the Chinese behemoth’s segment earnings. And though PetroChina lost money to the tune of RMB 11.2 billion on the sales of imported natural gas and liquefied natural gas (LNG) from Central Asia and Burma, the losses were narrower compared with the first half of 2018.
All these factors drove the group’s natural gas business’ income to RMB 18.3 billion in the period under review, improving from the year-earlier profit of RMB 16.1 billion.
Marketing: In marketing operations, the state-owned group sold 89,912 thousand tons of gasoline, diesel and kerosene during the six-month period, down 1.1% year over year. The effects of lower volumes were compounded by increase in operating expenses and the pitfalls of a cutthroat competitive environment. All these dragged down PetroChina’s Marketing segment profit to RMB 1.9 billion from RMB 4.5 billion recorded in the same period last year.
Liquidity & Capital Expenditure
At the end of the quarter, the group’s cash balance was RMB 90.6 billion, while cash flow from operating activities was RMB 134.4 billion. Capital expenditure for the six months reached RMB 84 billion.
Zacks Rank & Stock Picks
PetroChina currently carries a Zacks Rank #3 (Hold). Meanwhile, investors interested in the energy space could look at a better option like National Oilwell Varco (NYSE:NOV) that sports a Zacks Rank #2 (Buy).
You can see the complete list of today’s Zacks #1 Rank (Strong Buy) stocks here.
Over 30 days, the Houston, TX-based National Oilwell Varco has seen the Zacks Consensus Estimate for 2019 and 2020 increase 92% and 100%, respectively.
Today's Best Stocks from Zacks
Would you like to see the updated picks from our best market-beating strategies? From 2017 through 2018, while the S&P 500 gained +15.8%, five of our screens returned +38.0%, +61.3%, +61.6%, +68.1%, and +98.3%.
This outperformance has not just been a recent phenomenon. From 2000 – 2018, while the S&P averaged +4.8% per year, our top strategies averaged up to +56.2% per year.
CNOOC Limited (CEO): Free Stock Analysis Report
China Petroleum & Chemical Corporation (SNP): Free Stock Analysis Report
National Oilwell Varco, Inc. (NOV): Free Stock Analysis Report
PetroChina Company Limited (PTR): Free Stock Analysis Report
Original post
Zacks Investment Research