In its nine-month operational update, Pan African Resources PLC (LON:PAFR) disclosed production that is consistent with its FY19 guidance of 170,000oz. This caused us to reduce our FY19 forecasts fractionally in anticipation of lower production than we previously expected from Barberton offset by higher (but lower-margin) production from Evander underground and the BTRP. More importantly, however, Pan African’s directors approved the development of the Evander 8 Shaft pillar project, with production from as early as August, causing us to increase our forecasts for FY20 and beyond and our ultimate valuation of the company.

Evander 8 Shaft pillar project production imminent
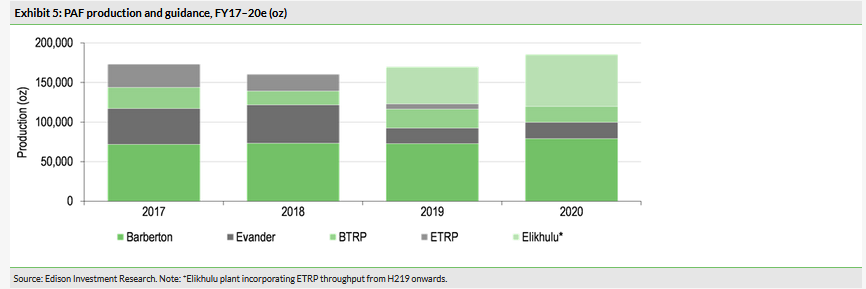
The Evander 8 Shaft pillar project will contribute, on average, 30,000oz of production per annum to the group over the next three financial years, including c 20,000oz in its first year of production, with the result that management has increased its group-wide production guidance for FY20 from 170,000oz to 185,000oz currently (an increase of 8.8%). According to the project’s updated feasibility study, capital expenditure will amount to ZAR70m, of which ZAR40m will pre-date production, while all-in sustaining costs have been estimated at US$900/oz (at an exchange rate of ZAR14.30/US$). The pre-tax NPV of the project on this basis is US$25.8m (1.3 US cents per share) at a 10% discount rate and a gold price of US$1,305/oz.
Valuation: Up 1.31p/share to 19.00p plus 19.2Moz
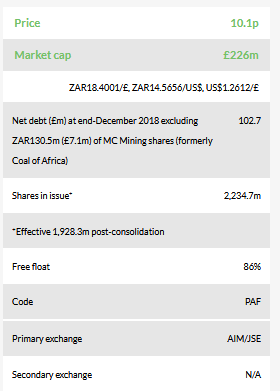
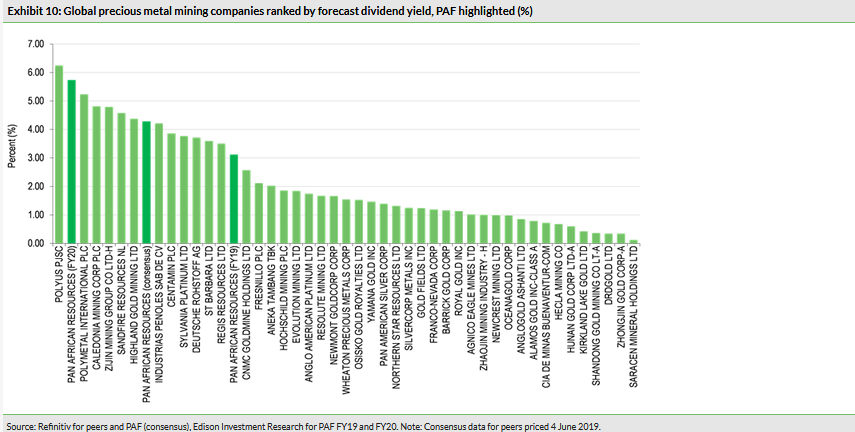
Including the Evander 8 Shaft pillar project, our headline absolute valuation of PAF has increased from 12.90p/share to 14.05p/share – a rise of 8.9%. This increases to 19.00p/share (cf 17.69p previously) once growth projects and other assets have been taken into account, plus the value of c 19.2m underground Witwatersrand ounces, which could lie anywhere in the range of 0.17–4.15p per share, depending on market conditions. In the meantime, if PAF’s historical average price to normalised EPS ratio of 9.4x in the period FY10–18 is applied to our respective forecasts, its share price could be expected to be 9.3p in FY19, rising to 17.6p in FY20 (cf 16.1p previously). Pan African also remains cheaper than its South African- and London-listed gold mining peers on at least two-thirds of valuation measures regardless of whether Edison or consensus forecasts are used. Finally, based on our assumptions, its dividend yield will be within the top third (if not the top 10) of the 45 precious metals companies expected to pay a dividend over the course of the next 12 months, if not in FY19 then certainly in FY20 (see Exhibit 10 on page 8).
Business description
Pan African Resources has three major producing or near-producing precious metals assets in South Africa: Barberton (target output 95koz Au pa), the Barberton Tailings Retreatment Project (20koz) and Elikhulu (55koz) incorporating the Evander Tailings Retreatment Project (10koz).
Q1–Q319 production
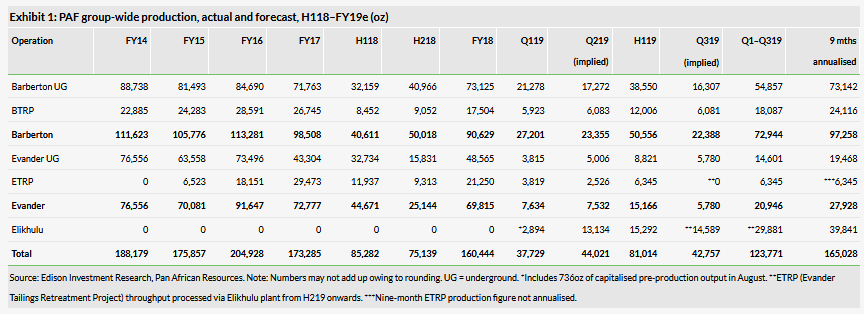
In its nine-month operational update, Pan African disclosed production that is consistent with its full year guidance of 170,000oz, which it reiterated for the 12-month period to end June 2019.
Highlights of the period were:
- Throughput of 1.3Mt in March at Elikhulu (100,000t above nameplate capacity), while all-in sustaining costs continued to be lower than previously anticipated, at less than US$600/oz.
- Production at the Barberton Tailings Retreatment Project (BTRP) increased by 47.5% compared to the equivalent period in 2018, to 18,087oz, following the successful commissioning of the 1.7MW BTRP regrind mill in May 2018 that has allowed it to efficiently treat coarser fraction tailings, such as the older (albeit lower-grade) Harper dumps for processing.
- Zero fatalities during Q3, while the group’s lost-time injury frequency rate improved substantially, to 1.75 (cf 3.79) and its reportable injury frequency rate improved to 0.58 (cf 1.17).
FY19 production guidance
Management stated that it is confident that it ‘remains on track to meet its gold production guidance of 170,000oz for the full financial year to end 30 June 2019’. Within this context, we have adjusted our production forecasts for each asset for FY19, as follows:
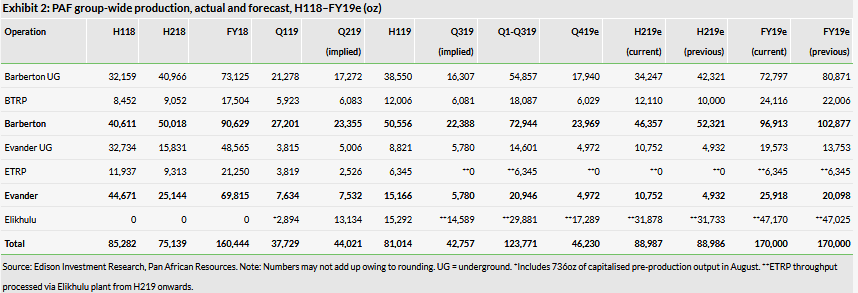
Notable changes in our forecasts include a 10.0% increase in production from Barberton underground (Q4 vs Q319) under the influence of three cycling production platforms (including the 256 level platform), which will increase underground mining flexibility still further in conjunction with a concurrent increase in underground development rates. Nevertheless, production at this level is consistent with flat mill throughput (H2 vs H119) at a reduced (and historically relatively low) grade of 9.01g/t – auguring well for an output increase in FY20 when grades may be expected to return to close to their long-term average in the range 10.25–10.75g/t.
Updated FY19 financial forecasts
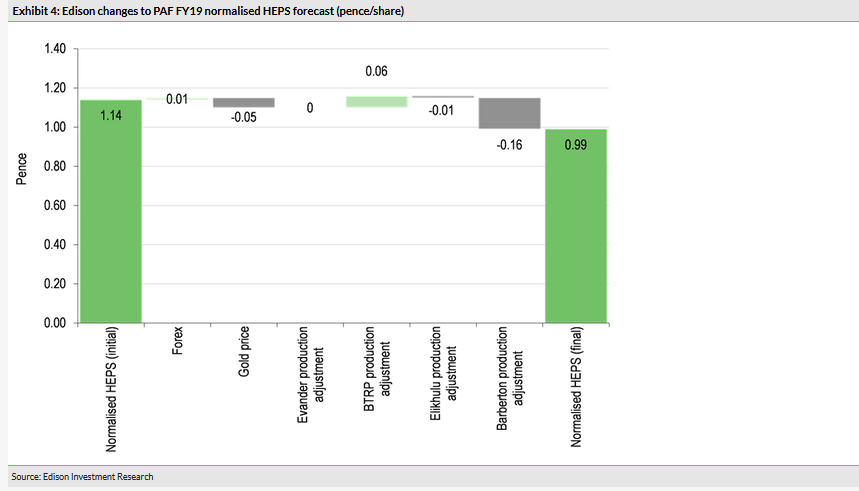
Other changes to our assumptions for H219 are that the gold price has been approximately 2% weaker than our prior expectations (estimated US$1,296/oz vs US$1,323/oz previously), only partially mitigated by a South African rand that has been approximately 1% weaker against both sterling and the dollar.
A summary of our updated financial expectations performance is as follows:
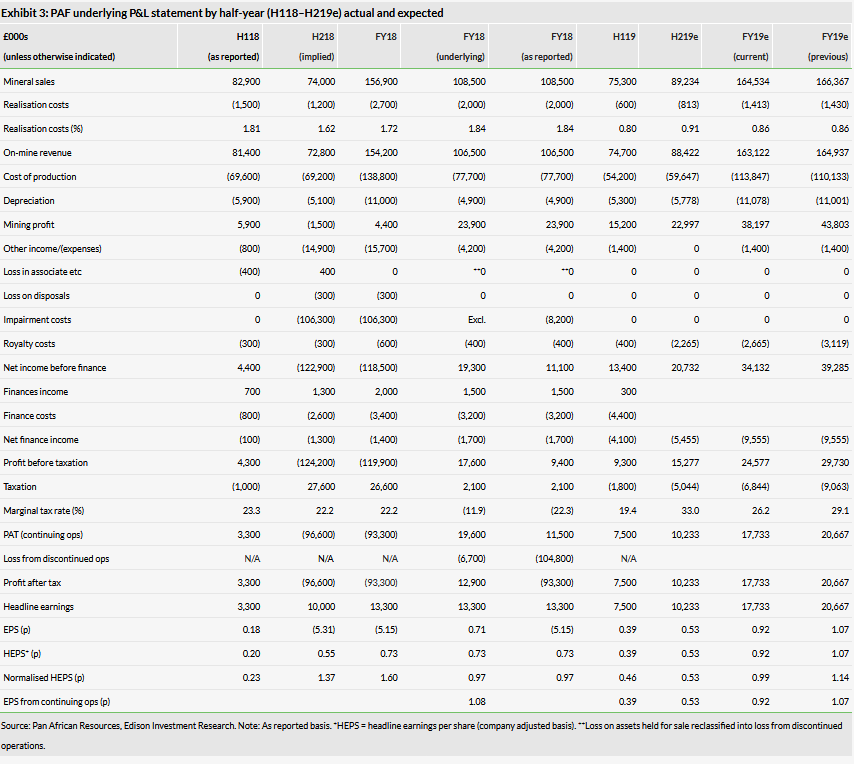
The major reasons behind the reduction in our forecasts for FY19 are the lower gold price and the decline in forecast production from Barberton in H219, only partially offset by foreign exchange rates and the increase in forecast production from the BTRP, as shown in the chart below (created with reference to normalised headline earnings per share (HEPS) in Exhibit 3, above):
FY20 and beyond
The other major development since Edison’s last note (see Pan African: Elikhulu underpins recovery, published on 12 March 2019) is Pan African’s board of directors’ approval of the Evander 8 Shaft pillar project. Moreover, whereas Edison had previously valued this asset in the expectation of commercial production not being achieved until after the end of FY20, development and equipping of this area of the mine is reported to have already started, with first gold anticipated during August 2019. As such, the project will effectively replace current remnant underground mining and vamping production and PAF expects it to contribute, on average, 30,000oz of production per annum to the group over the next three financial years, including c 20,000oz in FY20, with the result that management has increased its group-wide production guidance for that year from 170,000oz previously to 185,000oz currently (an increase of 8.8%), as shown in the graph below:
A summary of the (updated) results of the Evander 8 Shaft pillar project feasibility study are as follows:
- initial capex of ZAR40.0m (cf ZAR15.4m previously);
- total capex of ZAR70.0m (cf ZAR56m previously);
- throughput rate of 11.5ktpm producing 30koz per annum, on average, with peak production of 39koz in the second year of operations;
- An average all-in sustaining cost of approximately ZAR415,000/kg, or US$900/oz over the life of the project (assuming a forex rate of ZAR14.30/US$);
- A three-year life-of-mine; and
- a project pre-tax NPV of US$25.8m (cf US$19.4m previously), which equates to a value of 1.3 US cents per share, at a 10% real discount rate and an assumed gold price of ZAR600,000/kg, or US$1,305/oz.
Edison has now incorporated these assumptions into our financial forecasts for FY20 and beyond (including a small reduction in anticipated output from Barberton, from 84koz to 79koz), with the result that our normalised HEPS forecast for Pan African’s next financial year has increased by 9.3%, to 1.88p/share, as shown below:
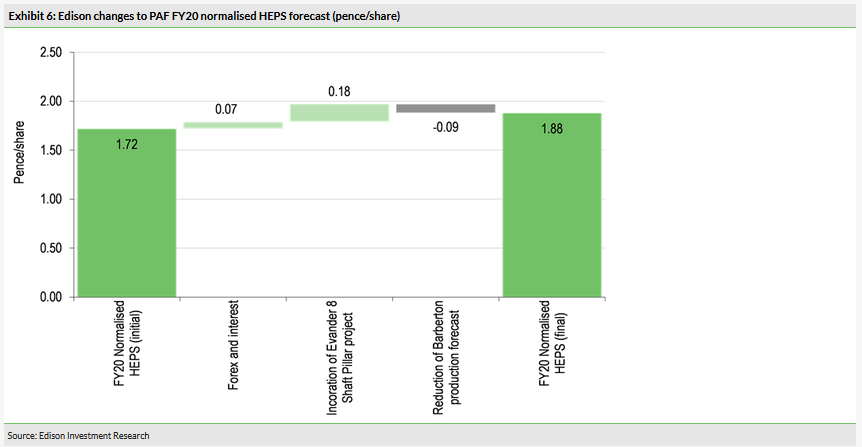
Note that FY20 forecasts are predicated on an unchanged gold price forecast of US$1,372/oz.
At the same time that it approved the Evander 8 Shaft pillar project, the group concluded that it would not pursue mining the near-surface Royal Sheba resource on a standalone basis, but that it would instead upgrade the existing Barberton Mines processing plant infrastructure to take Royal Sheba ore. Among other things, this will also help to expedite the environmental licensing process, shorten the timeline to production, enhance returns and negate the need for external capital funding.
Updated group valuation
Including its other potential growth projects (ie the Fairview sub-vertical shaft project and Egoli) and assets (ie the residual Evander underground resource and its shareholding in MC Mining), a summary of our updated valuation of Pan African is as follows:
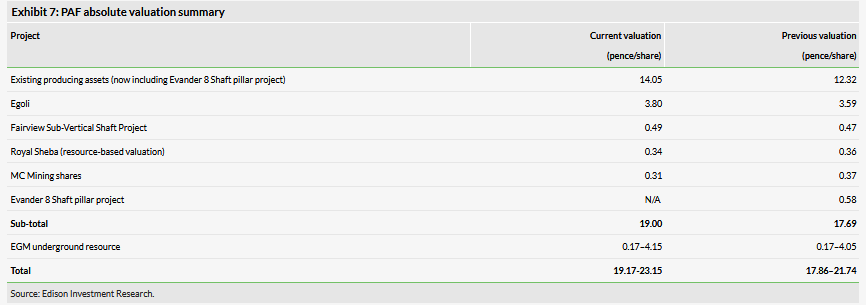
Note that the valuation changes for Egoli and the Fairview sub-vertical shaft project reflect the effect of foreign exchange rate changes only, whereas the change in the implied valuation of the Evander 8 Shaft pillar project reflects both foreign exchange rate changes and the fact that the timing of the project has been accelerated relative to our previous expectations. The decline in the value of PAF’s shareholding of 13.1m MC Mining shares reflects merely the fall in the latter’s share price from c ZAR9.99/share in November 2018 to ZAR8.49/share at the time of writing (adjusted into sterling at the appropriate FX rate).
Historical relative and current peer group valuation
Historical relative valuation
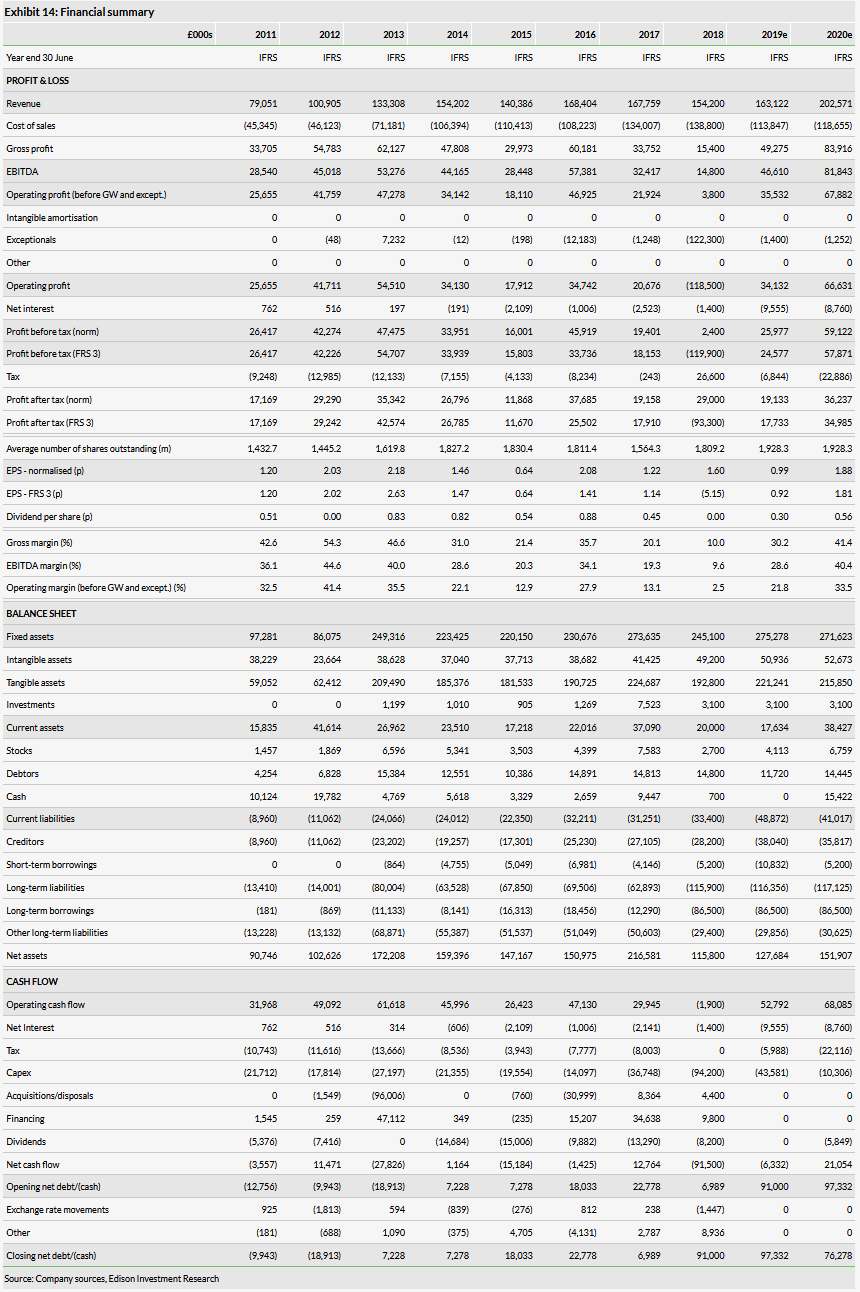
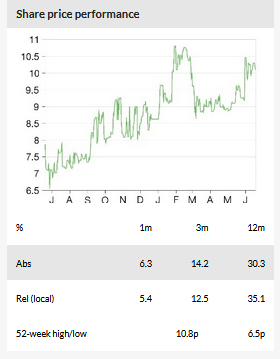
Exhibit 8, below, depicts PAF’s average share price in each of its financial years from FY10 to FY18, and compares this with normalised HEPS in the same year. For FY19 to FY20, the current share price (of 10.1p) is compared with Edison’s forecast normalised HEPS for FY19 to FY20. As is apparent from the graph, PAF’s price to normalised HEPS ratio of 10.2x for FY19 (based on our forecasts – see Exhibit 14, below) is close to the average of its recent historical range of 9.4x from FY10–18. However, assuming it meets Edison’s (and consensus) earnings expectations for FY20, this measure of value is set to fall to a record low for the period of just 5.4x (see below):
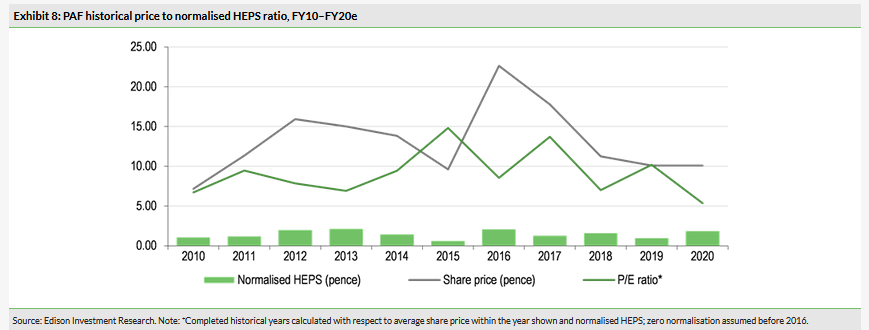
Stated alternatively, if PAF’s average contemporary price to normalised EPS ratio of 9.4x in the period FY10–18 is deemed ‘correct’, then its share price should be 9.3p in FY19 and 17.6p in FY20 (cf 16.1p previously).
Relative peer group valuation
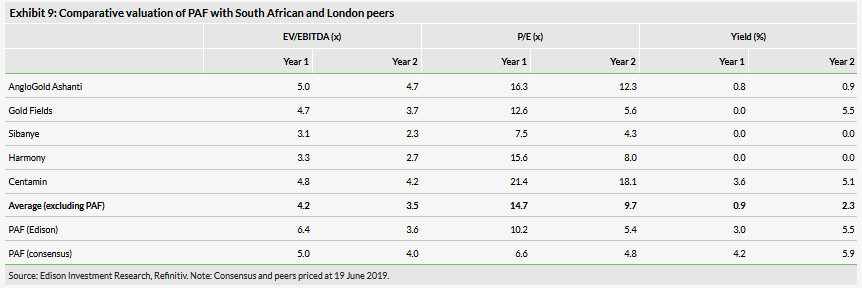
Over the next two years PAF remains cheaper than its South Africa- and London-listed gold mining peers on at least two-thirds of valuation measures (20 out of 30 individual measures in the table below), regardless of whether Edison or consensus forecasts are used.
Dividend
PAF has a target dividend pay-out ratio of 40% of net cash generated by operating activities, after allowing for the effect of sustaining capital on cash flow, contractual debt repayments and one-off items. After sustaining the costs related to the Evander underground closure in FY18, the Pan African board elected not to recommend a final dividend for that year. However, it stated that recommencing distributions to shareholders is a priority for the future.
Cash flows before financing activities were negative £14.3m in H119 and we forecast that they will be positive £8.0m in H219 under the influence of an improved operating performance, a better gold price and a steady rand. As a result, we expect group net indebtedness at the end of FY19 to be broadly similar to that at the end of FY18 (ie £97.3m vs £91.0m). Nevertheless, that represents a decline relative to our previous estimate of £94.0m – primarily as a result of the acceleration of capex relating to the Evander 8 Shaft pillar project into FY19. Given that PAF’s dividend policy is for a pay-out of 40% of net cash generated by operating activities after allowing for the effect of sustaining capital (but not expansionary capital other than value-accretive new growth projects), we believe there is scope for the board to recommend a dividend of up to 0.30p/share this year, albeit that represents a decline compared to our previous estimate of 0.38p/share. Self-evidently, the extent to which a dividend may (or may not) be declared will depend on developments between now and September 2019 as well as due regard for PAF’s banking covenants (see Exhibit 13). However, given that any dividend declared for FY19 would be paid in FY20, such a distribution would not affect the ratios pertinent to PAF’s banking covenants for end-FY19, but rather H120 (ie at 31 December 2019), when we forecast that PAF will be in the process of paying down net debt at a rate in excess of £20m per annum (excluding dividend distributions).
If our dividend forecast is correct, however, then Pan African will still have a dividend yield in the top third of the 45 ostensibly precious metals companies paying dividends to shareholders over the course of the next 12 months. Note that there is no certainty nor guidance that an FY19 dividend will be paid; however, we observe that, in extremis, Pan African could fund our forecast FY19 dividend via the realisation of its shareholding in MC Mining. Should it pass its dividend for FY19 however, then we would regard it as an almost racing certainty (all other things being equal) that it would make a full distribution to shareholders in FY20 (see Exhibit 14, below). If it were to pass its dividend in FY19, it would also create the possibility that the company could initiate an interim dividend payment to shareholders in H120 instead.
Financials
PAF had net debt of £102.7.0m on its balance sheet as at 31 December 2018 (cf £91.0m as at June 2018, £42.2m as at December 2017 and £7.0m as at June 2017). As such, net debt equated to a gearing (net debt/equity) ratio of 82.2% (cf 78.6% as at end-FY18) and a leverage (net debt/[net debt + equity]) ratio of 45.1% (cf 44.0% as at end-FY18).
As of the current time, the most intense phase of capex relating to Elikhulu has now been completed and we expect group capex to decline sharply to ZAR193.0m in H219 compared to ZAR585.9m in H119 – albeit the decline has been slightly moderated by the acceleration of Evander 8 Shaft pillar project capex into H219 ahead of first gold in H120. Hereafter however, we expect Pan African to be strongly cash-generative (including contributions from the Evander 8 Shaft pillar project), such that it will pay down net debt at a rate in excess of £20m per annum (before dividend distributions), as shown in Exhibit 12, below:
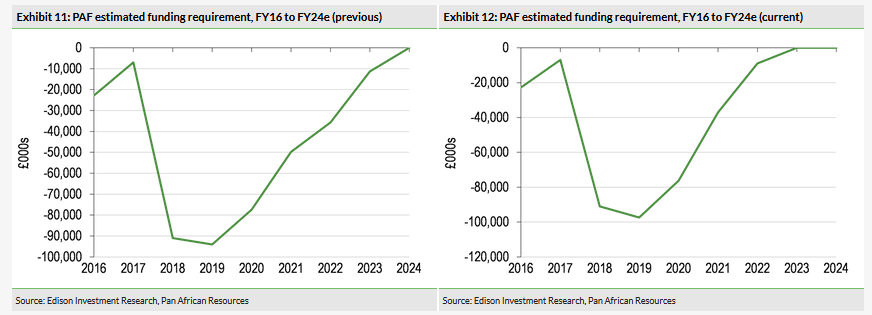
As a consequence of the increased cash flows during the period FY20–24, we therefore now predict that Pan African will be net debt free by the end of FY23, cf FY24 previously.
Debt is principally financed via a ZAR1bn revolving credit facility (£54.3m at current exchange rates) plus a ZAR1bn term loan facility relating to the Elikhulu project and a banking facility. Principal on the Elikhulu facility is payable in equal instalments until maturity in June 2024, while the revolving credit facility (RCF) itself has been restructured to extend its maturity from mid-2020 previously to at least beyond mid-2024 currently. The group’s RCF debt covenants and their actual recorded levels within recent history are as follows:

Note that, with the agreement of its bankers, PAF’s net debt:EBITDA covenant is measurable only on 31 December 2019 to accommodate the construction of the Elikhulu project, while the interest cover ratio was reduced to 2.5:1 as at December 2018 (with the requirement that it be 4:1 thereafter).
Miscellaneous
Accounting
Management has announced that the group’s presentation currency is expected to change to US dollars, from sterling, for Pan African’s results for the full year to end-June 2019. Note that our forecasts in this note nevertheless continue to be presented in sterling to be consistent with historical practice.
