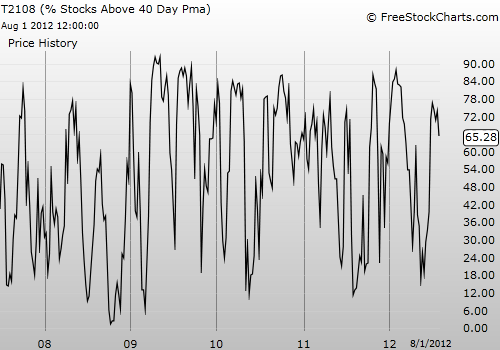
: 65.3% (first day of a new overbought period)
VIX Status: 19
General (Short-term) Trading Call: Hold.
Commentary
T2108 fell out of overbought territory after a 3-day stint. Unlike the previous two overbought trips, this one did not provide a perfect opportunity to fade from resistance. On the other hand, the end of the overbought period did not bring the S&P 500 to natural support.
The first firm support should be just a few points away around 1369, the 2011 high. I will look to dump my latest round of SSO puts around there, and hopefully for near breakeven.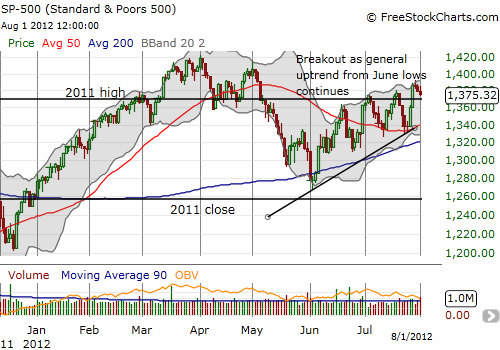
So, for now, little has changed in the bullish outlook. The persistent grinding upward, the higher highs and higher lows, the continued push into overbought territory all continue to display the relative strength of the buyers.
In case you think the eurozone sovereign debt crisis remains a clear and present danger to the U.S. stock market, I present this weekly chart as a reminder that the S&P 500 in general is printing higher highs and higher lows after each episode of europanic. 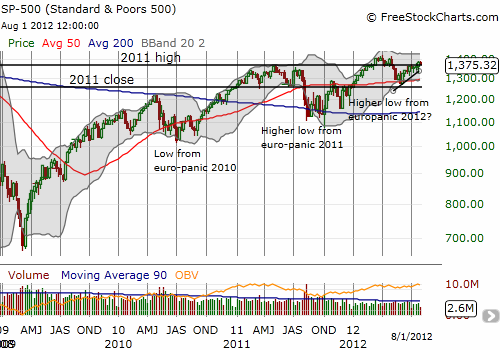
I did take the opportunity to unload my shares in Siemens (SI) (my europanic contrarian play). It is at the top of its trading range, and I did not feel comfortable holding it through the Federal Reserve latest announcement on monetary policy.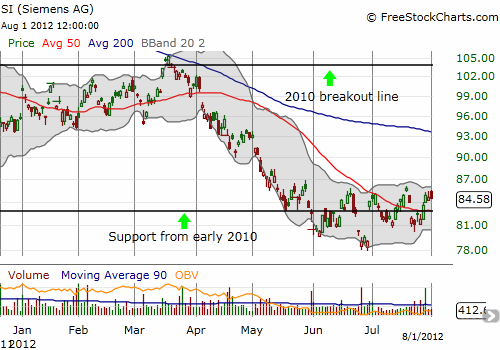
Finally, Caterpillar (CAT) has moved from a promising breakout above its 50DMA to a disappointing return to its pre-earnings closing price. I was looking to CAT as the final piece in the puzzle of starting an extended overbought rally. Back to the drawing board for now!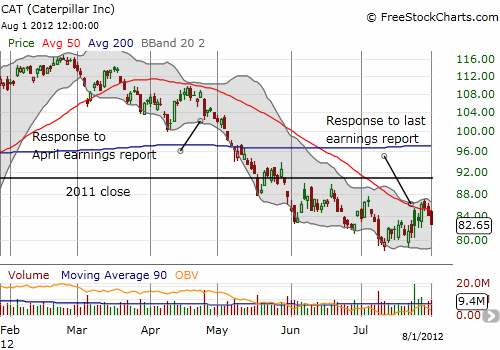
Daily T2108 vs the S&P 500
Click chart for extended view with S&P 500 fully scaled vertically (updated at least once a week)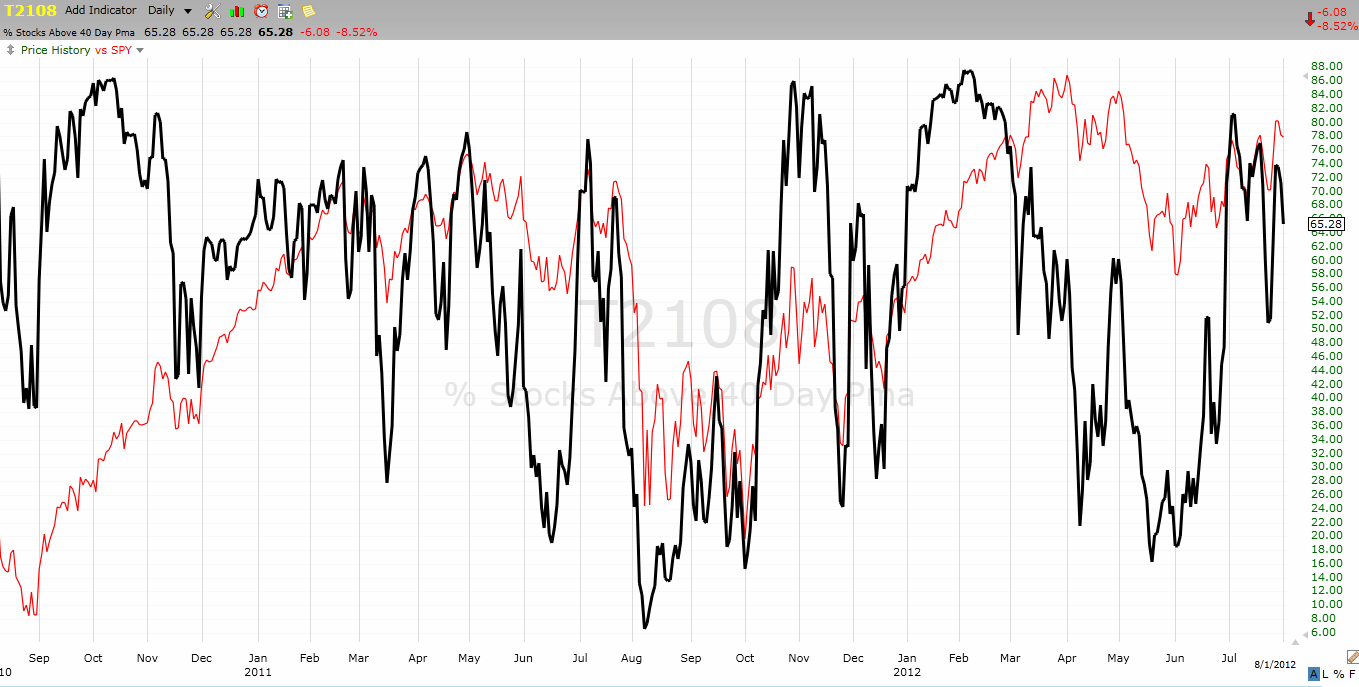
Full disclosure: long SDS; long SSO puts; long CAT
- English (UK)
- English (India)
- English (Canada)
- English (Australia)
- English (South Africa)
- English (Philippines)
- English (Nigeria)
- Deutsch
- Español (España)
- Español (México)
- Français
- Italiano
- Nederlands
- Português (Portugal)
- Polski
- Português (Brasil)
- Русский
- Türkçe
- العربية
- Ελληνικά
- Svenska
- Suomi
- עברית
- 日本語
- 한국어
- 简体中文
- 繁體中文
- Bahasa Indonesia
- Bahasa Melayu
- ไทย
- Tiếng Việt
- हिंदी
Overbought Period Ends As Breakout Wavers
Published 08/02/2012, 02:39 AM
Updated 07/09/2023, 06:31 AM
Overbought Period Ends As Breakout Wavers
T2108 Status
Latest comments
Loading next article…
Install Our App
Risk Disclosure: Trading in financial instruments and/or cryptocurrencies involves high risks including the risk of losing some, or all, of your investment amount, and may not be suitable for all investors. Prices of cryptocurrencies are extremely volatile and may be affected by external factors such as financial, regulatory or political events. Trading on margin increases the financial risks.
Before deciding to trade in financial instrument or cryptocurrencies you should be fully informed of the risks and costs associated with trading the financial markets, carefully consider your investment objectives, level of experience, and risk appetite, and seek professional advice where needed.
Fusion Media would like to remind you that the data contained in this website is not necessarily real-time nor accurate. The data and prices on the website are not necessarily provided by any market or exchange, but may be provided by market makers, and so prices may not be accurate and may differ from the actual price at any given market, meaning prices are indicative and not appropriate for trading purposes. Fusion Media and any provider of the data contained in this website will not accept liability for any loss or damage as a result of your trading, or your reliance on the information contained within this website.
It is prohibited to use, store, reproduce, display, modify, transmit or distribute the data contained in this website without the explicit prior written permission of Fusion Media and/or the data provider. All intellectual property rights are reserved by the providers and/or the exchange providing the data contained in this website.
Fusion Media may be compensated by the advertisers that appear on the website, based on your interaction with the advertisements or advertisers.
© 2007-2024 - Fusion Media Limited. All Rights Reserved.
