The following are the intraday outlooks for USD Index (DXY), EUR/USD, NZD/USD, S&P 500, and Crude Oil as provided by the technical strategy team at SEB Group.
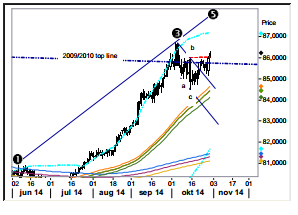
USD INDEX: Broke the b-wave high. The index didn’t reach the former flag ceiling (now acting support) before the buyers stepped up to the plate buying the greenback and did so in a bullish manner, creating a bullish key day reversal. The bullish candle together with the break of the b-wave high is both strong indications that the monthly long correction now is over and that fresh highs are lurking near time. The target for wave 5 should ideally be sought towards the estimated trend line connected by the wave 1 and 3 peaks, 88.20+ ish.
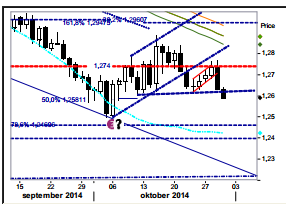
EUR/USD. Finally down from the bear flag. The minor bear flag (following the exit of the larger one) finally came to an end yesterday and did so in vigor printing a bearish key day reversal. Today’s violation of the 1.2605 key support has further enhanced a bearish view (and so does the fact that the Oct correction more or less has taken the shape of a head and shoulders top (with a theoretical target at 1.2322). The market will now trace out a new low below the prior 1.2501 one.
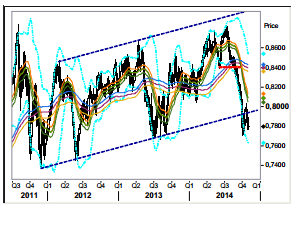
NZD/USD: Hanging below the former flag. The Kiwi remains very exposed to a further selloff given both the fact that we technically are in a very weak position hanging and struggling below the former trend line and secondly given the action from the RBNZ (next hike not imminent and the currency seen as unsustainable strong). If/once letting go of the trend line the transition down to the 2011/12 low area can be pretty fast.
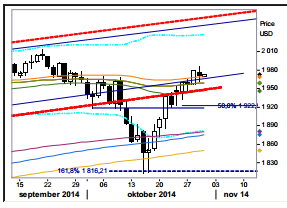
S&P 500: A muted FOMC reaction. The reaction to the ending of QE3 became muted with the market soon recovering most of the initial losses (that on the other hand wasn’t especially big). On the other hand a move back above 1979 is needed to call for an immediate move higher whereas staying below the resistance keeps the door open to a 1955 dip (before moving higher). Resistance 1979 1986 2015 2055 Support 1962 1955 1945 1919 61,8% 83 100,0% 89,17 50,0% 84,59 87.93 Price USD Bbl 83 84 85 86 87 88 89 29 06 13 20 27 03 10 17 sep 14 oktober 2014 november 2014.
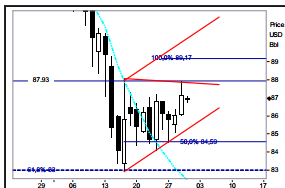
BRENT CRUDE: Can still be a triangle. As long as the market doesn’t trade above 88.00 a bearish triangle wave count can be justified (above 88.00 a bearish flag wave count will become our alternate path). Yesterday’s spike just below 88.00 is encouraging if looking for toppish signs but to add confidence to a completed correction the market at least needs to fall below yesterday’s low point, 86.06.

