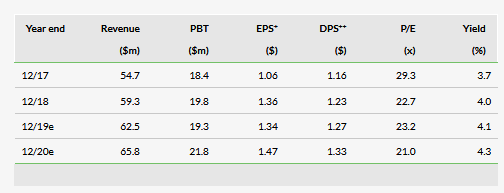
Otc Markets Group (OTC:OTCM)’s first-quarter figures were affected by the one-off costs of its headquarters move and investment in additional headcount and IT infrastructure, in part supporting incremental acquisitions. These investments are set to support future growth and, following more recent share price weakness and despite a reduction in our EPS estimates, the prospective P/E rating is now below that of peers.
Q119 results
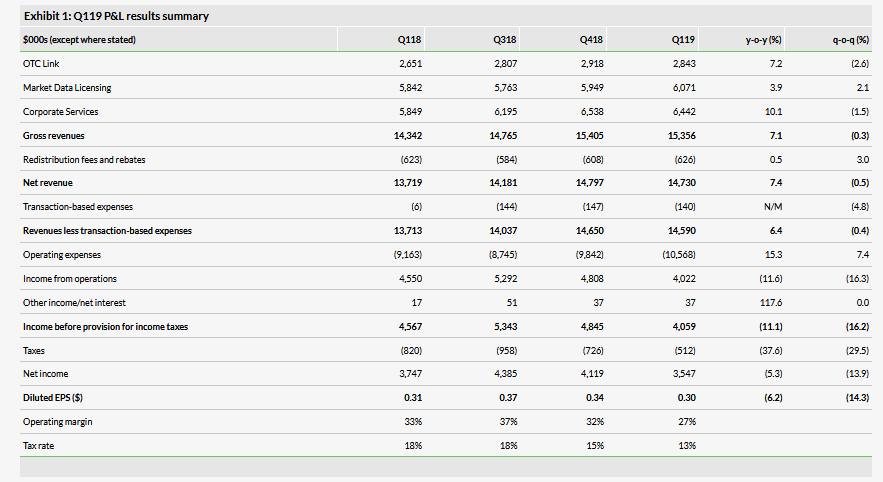
OTC Markets Group (OTCM) reported gross revenue up 7% versus Q118 including 10% growth in Corporate Services, within which OTCQX Best market benefited from 16% corporate client growth, a particularly encouraging indicator. While Market Data Licensing growth appeared subdued at 4%, this was partly held back by the absence of one-off revenue that benefited Q118 and compliance data sales growth continued. OTC Link was affected by lower market activity levels, but this was more than offset by continuing traction at OTC Link ECN, which allowed revenue to grow by 7%. Operating expenses rose 15%, including one-off HQ move costs of c $0.5m, leaving pre-tax profits down 11% and diluted EPS, after a reduced tax charge, down 6%. Excluding one-off costs, net income would have risen 7%. The quarterly dividend has been maintained at $0.15.
Market background and outlook
Equity market performance year to date has been positive and, providing macro concerns including global trade tensions do not reverse this, the background for the corporate sector and therefore OTCM should remain relatively attractive. OTCM continues to focus on improving the transparency and regulatory recognition of its markets and, reflecting the progress made to date, we expect further gains on this front to benefit the reputation of its markets. In the future, this could mesh with the development of online fund-raising, which may create a larger pool of companies interested in the cost-effective secondary trading platforms offered by OTCM.
Near-term estimates trimmed, but valuation held
Reflecting one-off and ongoing costs, our EPS estimates for FY19 and FY20 are reduced by 7% and 3% respectively. However, longer-term cash flows should benefit from investments in headcount and add-on acquisitions, so we maintain our estimated fair value at $37.
Business description
OTC Markets Group operates the OTCQX, OTCQB and Pink financial markets for over 10,000 US and global securities. OTC Link LLC, a member of FINRA, operates OTC Link ATS and OTC Link ECN, both SEC-registered Alternative Trading Systems. Approximately 87% of revenues are of a subscription-based recurring nature.
Q119 results analysis
OTCM’s first-quarter results showed gross revenues 7% ahead of the same period last year; net of redistribution fees and transaction-based expenses, the increase was 6%. Operating expenses were up by 15%, including one-off costs of moving into the group’s new HQ office, which accounted for five percentage points of the rise. This left pre-tax profits 11% below Q118 but, excluding the one-off move costs, profits would have been virtually unchanged. A lower tax charge (13% versus 18%) meant the net income reduction was 5% while, excluding one-off costs, net income would have increased by 7%. This was in a period during which the group invested in additional headcount and infrastructure to support the sustainability and growth of existing and acquired businesses. OTCM declared a maintained quarterly dividend of $0.15.
Looking more closely at the revenue progression (Exhibit 2), the largest contribution to growth was from Corporate Services (+10%). Here, OTCQX, with revenues up 18%, benefited from a higher number of client companies (+16%), while OTCQB had a slightly lower client count but saw 12% higher revenues as all companies were on an increased fee schedule in this quarter.
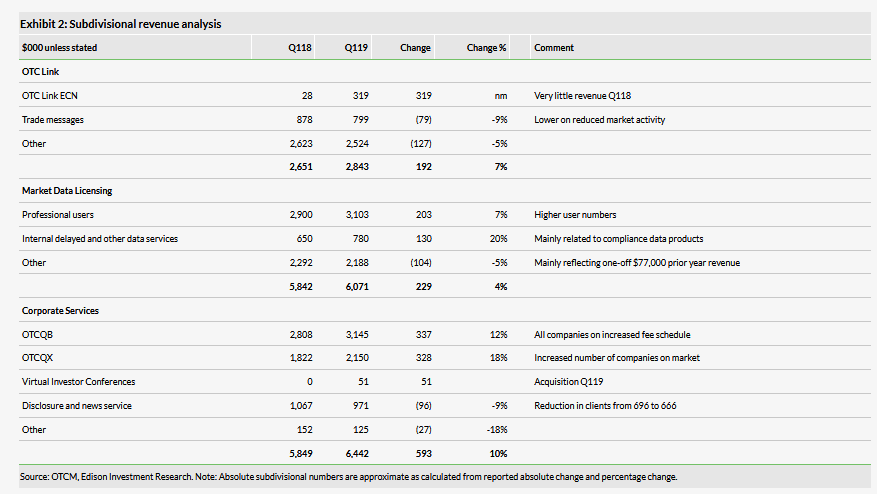
Within Market Data Licensing, the salient features were revenue increases arising from a higher number of professional users and increased sales of compliance data products. The number of subscribers to compliance data packages has increased from 21 at end Q118 to 30 at end Q119, reflecting OTCM’s success in developing this area of its business through developing products that facilitate monitoring and automation of processes at customers’ compliance departments.
As in previous quarters, the OTC Link revenue comparison benefited from the inclusion of OTC Link ECN, which only started to make a significant contribution from Q218. Otherwise, messaging fees were lower on the back of reduced market activity in comparison with Q118, which was a volatile and more active period.
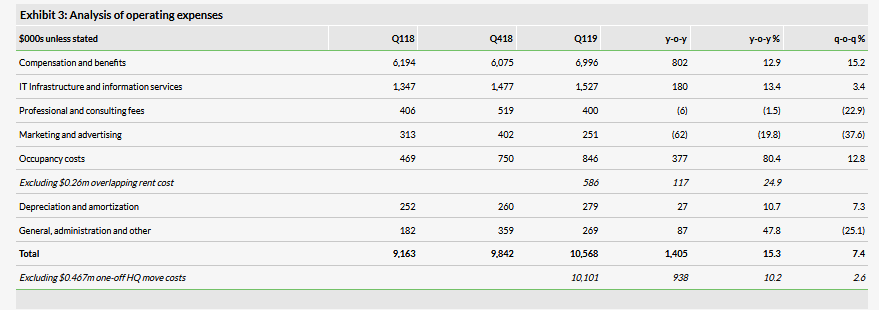
Given the significant increase in operating expenses in the period, particularly compared with Q118, we have collated the expense analysis to show the changes from Q418 and the prior year quarter. As noted above, there were one-off costs associated with the move to the group’s new HQ at 300 Vesey Street, New York (in total $0.467m) and excluding these the increase in expenses was just over 10%. The largest element of cost is staff compensation and this was the largest contributor to this increase. In part, this reflected the rise in headcount from 91 at the end of Q118 to 98 (+7.7%), with the remaining growth relating to annual salary (+6% approximately), bonus and share compensation costs to ensure staff retention in a competitive market. After staff and occupancy costs, the third largest contributor to the increase in expenses was the IT infrastructure and information services category. Factors driving this increase included technology support for the Virtual Investor Conferences acquisition, a new tool to help manage market data contracts and enhancements to system security.
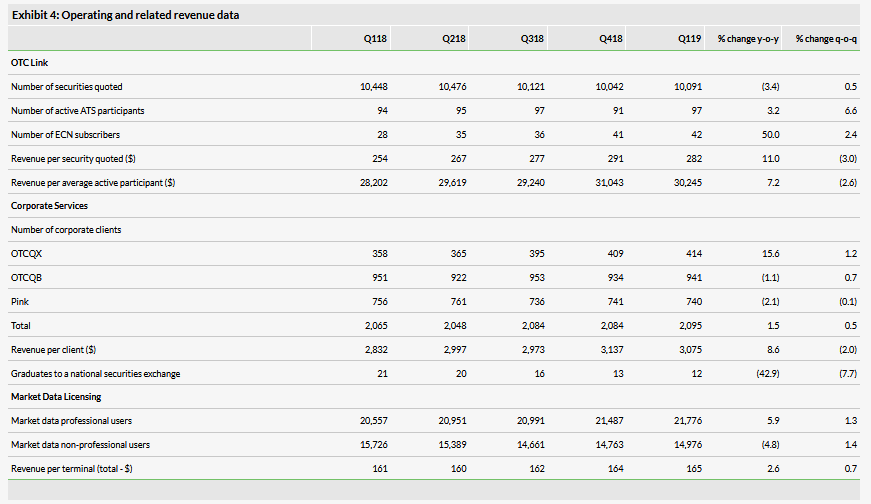
In Exhibit 4 we show selected quarterly operating metrics for the period between Q118 and Q119. We would highlight the following points from the table:
The number of active participants in OTC Link ATS recovered from the dip in Q418 and was slightly ahead of Q118. This represented welcome resilience, although we assume the background for broker dealers will remain challenging, potentially putting pressure on participant numbers. The number of OTC Link ECN subscribers has continued to grow and at the beginning of May stood at 43.
There has been a significant rise in the number of OTCQX client companies since last year (+16%) with stronger sales and a smaller number of downgrades during 2018. The retention rate for 2019 increased from 91% to 94%. The number of corporate clients at OTCQB was down marginally yo-y but up sequentially. The full application of earlier fee increases across the client base noted above generated the increase in revenue per client at OTCQB.
For Market Data Licensing, the 6% y-o-y increase in the number of professional users is encouraging and compared with subscribers to UTP Tape C (Nasdaq data) OTCM subscribers increased from 6.9% to 7.5%. Non-professional users did show a reduction but this figure has tended to fluctuate and has increased significantly over four years (from below 10,000).
Furthering its objective of broadening the range of services offered to corporate clients, OTCM integrated the activities of Virtual Investor Conferences (related assets acquired last year) and acquired Qaravan (risk and performance analytics on over 5,000 US banks and associated software) during the first quarter. Virtual Investor Conferences hosted three events and contributed initial turnover of $51,000 in Q119. At the time of the results, a further 13 events had been confirmed. Qaravan was acquired in February for a total consideration of $0.851m (of which $0.579m cash with the balance in shares). There is a contingent consideration subject to Qaravan’s recurring revenues on the second anniversary of the acquisition. Historical revenues are not disclosed and OTCM indicates that Qaravan is not expected to have a material impact on its results in the short term. On a longer view, the company believes there should be good opportunities to exploit synergies between its existing customer base among community/regional banks and the services offered by Qaravan. Both acquisitions are in line with the group’s indication that it seeks to make incremental purchases that fit with its existing activities in order to avoid the high risks entailed in a transformational transaction.
OTCM continues to focus on gaining regulatory recognition of its markets and last year five states were added to the list granting both markets Blue Sky recognition, taking the total to 34 for OTCQX and 31 for OTCQB. None was added in the first quarter, although OTCM indicate that North Dakota is likely to grant recognition in the second half of the year. In July 2018 the North American Securities Administrators Association (NASAA) published a model rule proposal for states to employ that would have the effect of granting OTCQX/QB recognition. While there is no timetable for its adoption, OTCM has previously mentioned that it is hopeful this might take place in the second quarter. Adoption is likely to facilitate further states granting recognition and it may be that some are awaiting formal adoption prior to making this move.
The Transfer Agent Verification programme is one of OTCM’s initiatives to improve transparency in its markets by providing current information on share capital. OTCQX rules required corporates to provide data through the programme from the beginning of the year and at 1 May there were 39 agents participating, giving coverage of 99% of US companies on OTCQX and OTCQB markets.
Other developments in the quarter included the opening of a London office, currently with one employee, aimed at helping to develop international sales efforts for the two premium markets. On the new product front, Market Data Licensing launched a new compliance tool, Canari. This tool is designed to provide an overview of compliance data relating to OTCQX, OTCQB, Pink and Grey (no public quote) securities and build on the growth in compliance data sales to date.
Finally, it is pertinent to note that OTCM recorded a further quarter of 100% uptime in its core IT systems, a record that extends to over three years.
Background and outlook
The equity market background year to date has been markedly more positive than in Q418 such that total returns have been positive for the majority of markets over most periods shown in Exhibit 5. This provides a relatively favourable background in terms of corporate confidence/activity, although macro uncertainties such as trade tensions remain a potential restraining factor.

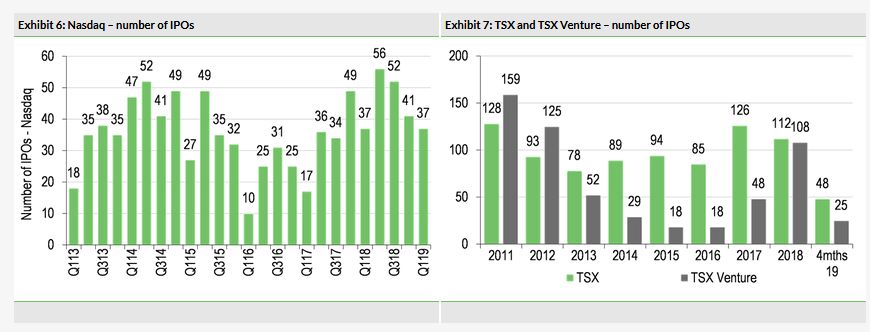
The next two charts show IPO numbers for Nasdaq, and the Canadian TSX and TSX Venture exchanges as indicators of corporate and market confidence and activity. The number of IPOs on Nasdaq in the first quarter was unchanged from the prior year period at 37. On the Canadian exchanges, TSX IPOs in the first four months of the year were up 26%, while TSX Venture was running 17% below the prior year period. Not shown here, but the number of new admissions to AIM in the same period was down 65% with the marked weakness most likely reflecting political uncertainties in the UK, which are less relevant to OTCM.
OTCM itself is set to continue its focus on its five main objectives for the current year: (1) gain market share for OTC Link ECN; (2) ensure reliability of core systems; (3) win further regulatory recognition of the two premium markets; (4) enhance corporate client experience; and (5) expand the product offering through acquisitions.
On a longer view, achievement of greater regulatory recognition should progressively increase the reputation of the OTCM markets and enhance their appeal to corporates. In due course, this could act in tandem with the development of online/crowdfunding capital raising, which may create a larger population of companies interested in using OTCM’s cost-effective secondary markets.
Financials
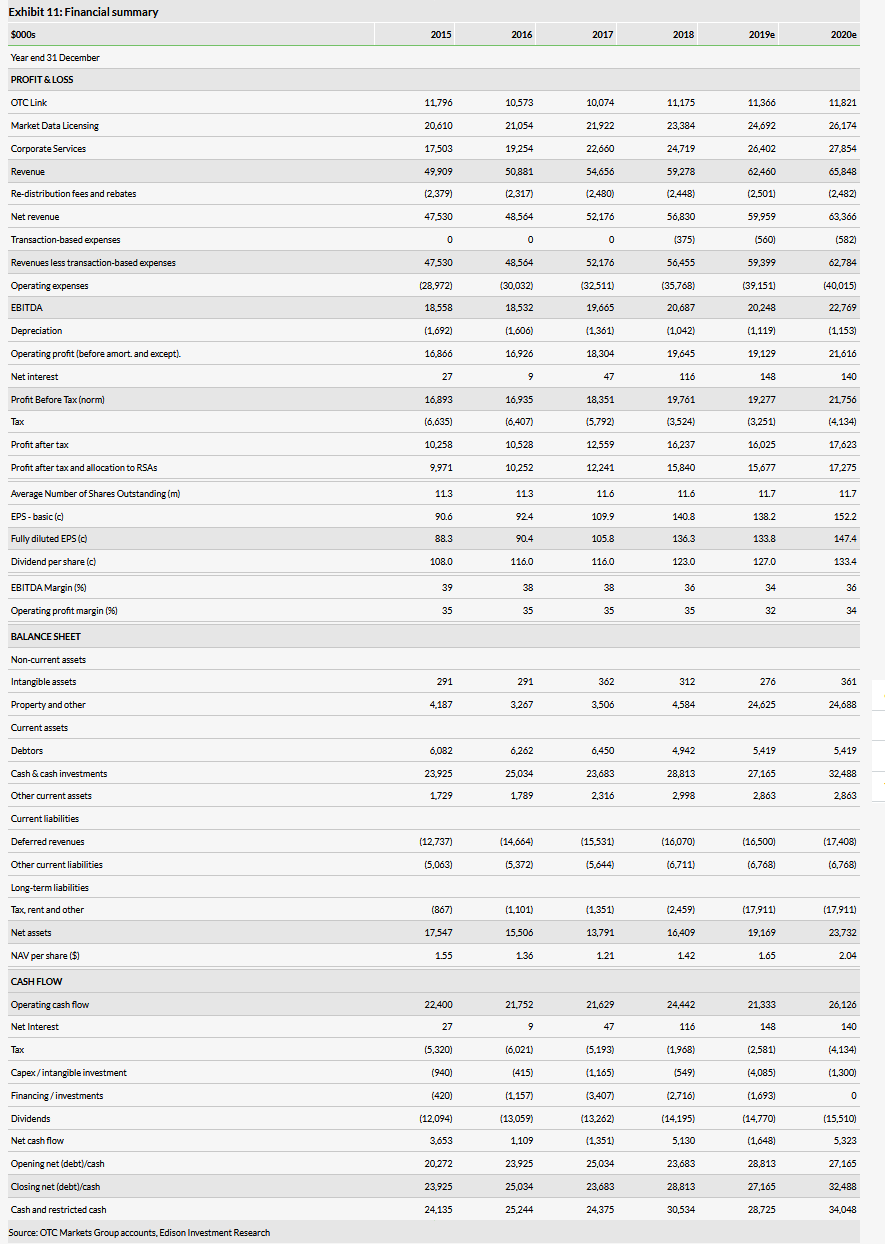
Changes in key estimate numbers are summarised in Exhibit 8, with further detail included in the financial summary on page 8. Our revenue assumptions are little changed, with slightly lower numbers for OTC Link but small increases for Corporate Services and Market Data Licensing to allow for a higher number of OTCQX corporate clients and some modest contribution from acquisitions/new products. Current year one-off move expenses of nearly $0.5m are factored in, together with higher than expected compensation costs that also affect FY20. The continuing increase in occupancy costs following the move to the new HQ are put at between $0.15m and $0.18m. We assume the tax charge will move back to c 18% following the 13% effective rate seen in the first quarter. The net effect is EPS estimate reductions of less than 7% and 3% for this year and next respectively.

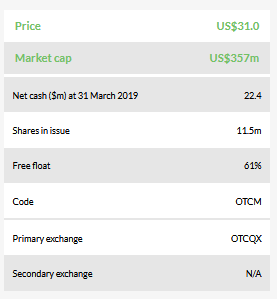
The balance sheet remains strong, with period-end cash standing at $22.4m compared with $22.7m at end Q118 and $28.8m at the end of 2018. During the first quarter, cash used in investing activities amounted to $3.5m including the cash element of the Qaravan purchase, leasehold improvements and IT spending at the new HQ office and data centre upgrades. Subject to the incidence of further acquisition opportunities, we expect spending to revert to a lower level, with a figure of $1.2m assumed in our estimate for FY20, for example.
Valuation
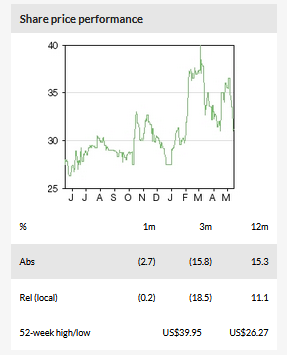
While OTCM shares are still c 17% up on a one-year view, they have shown weakness over three months (-15%) and this has left the prospective P/E below both the information providers and global exchange comparisons shown in the table below.

Using our discounted cash flow model to calculate the discount rate implied by the current share price ($31 at time of writing) gives a figure of 12.5%, which appears cautious (subject to our explicit forecasts for FY19/20 together with our assumption of FY21–22 cash flow growth of 5%, long-term growth of 4% and a terminal cash flow multiple of c 22x, compared with the current year value of 29x). The sensitivity table below shows how the value would change with discount rate and growth assumptions.

Although our FY19 and FY20 estimates have been reduced, this reflects a one-off effect in FY19, while investment in new products and incremental acquisitions should generate increased revenue growth over time and hence improved cash flows. Allowing for this through the assumption of slightly higher FY21–22 growth, our DCF valuation outputs are little changed and, taking this and the comparator valuations into account, we keep our fair value unchanged at $37.00.
