
O’Reilly Automotive Inc. (NASDAQ:ORLY) reported diluted earnings per share of $5.08 in third-quarter 2019, up 13% from $4.50 in the prior-year quarter. Moreover, the figure surpassed the Zacks Consensus Estimate of $4.78.
The company’s quarterly revenues rose 7% year over year to $2.67 billion. Moreover, the figure beat the Zacks Consensus Estimate of $2.63 billion. O’Reilly witnessed comparable store sales growth of 5% in the quarter ended Sep 30, 2019, compared with 3.9% rise in the year-ago quarter.
Net income amounted to $391 million for the quarter, up from $366 million recorded in the year-ago quarter.
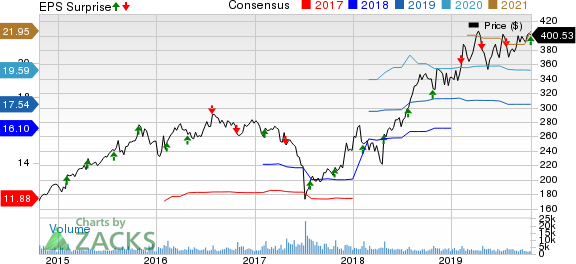
O'Reilly Automotive, Inc. Price, Consensus and EPS Surprise
Q3 Highlights
Gross profit grew 8% to $1.42 billion from $1.32 billion in the year-ago quarter. Selling, general and administrative expenses rose 7% year over year to $886 million from $831 million in third-quarter 2018. Operating income grew 11% to $536 million from $485 million reported in the prior-year quarter.
Share Repurchases
During the reported quarter, O’Reilly repurchased 1 million shares for $387 million at an average price of $377.85 per share. From the end of the quarter to the date of the earnings release, the company repurchased an additional 0.1 million shares of its common stock for $32 million at an average price of $393.33 per share.
Financial Position
The company had cash and cash equivalents of $42.8 million at the end of the third quarter compared with $40 million in the year-ago period. Its long-term debt increased to $3.7 billion as of Sep 30, 2019, from $3.1 billion as of Sep 30, 2018.
At the end of the third quarter, O’Reilly generated $642.7 million in cash from operating activities compared with $466.8 million recorded a year ago. During the period, capital expenditure amounted to $185.6 million compared with $126.3 million in the year-ago period. Further, free cash flow rose to $454.7 million from $327 million a year ago.
Outlook
For fourth-quarter 2019, O’Reilly projects earnings of $4.12-$4.22 per share. Further, the company expects 3-5% rise in consolidated comparable store sales.
For 2019, O’Reilly reiterated total revenue projection at $10-$10.3 billion and earnings per share at $17.75-$17.85.
For the year, the company expects free cash flow of $1.0-$1.1 billion.
Zacks Rank & Stocks to Consider
O’Reilly currently carries a Zacks Rank #3 (Hold).
Some better-ranked stocks in the Auto-Tires-Trucks sector are BRP Inc (NASDAQ:DOOO) and Sonic Automotive, Inc (NYSE:SAH) , currently sporting a Zacks Rank #1 (Strong Buy), and Asbury Automotive Group, Inc (NYSE:ABG) , carrying a Zacks Rank of 2 (Buy). You can see the complete list of today’s Zacks #1 Rank stocks here.
BRP has an expected earnings growth rate of 18.4% for 2019. The company’s shares have gained 68.5% year to date.
Sonic Automotive has an estimated earnings growth rate of 32.7% for 2019. Its shares have gained 114.5% year to date.
Asbury Automotive has an estimated earnings growth rate of 10.3% for 2019. Its shares have gained 45% year to date.
Today's Best Stocks from Zacks
Would you like to see the updated picks from our best market-beating strategies? From 2017 through 2018, while the S&P 500 gained +15.8%, five of our screens returned +38.0%, +61.3%, +61.6%, +68.1%, and +98.3%.
This outperformance has not just been a recent phenomenon. From 2000 – 2018, while the S&P averaged +4.8% per year, our top strategies averaged up to +56.2% per year.
See their latest picks free >>
Sonic Automotive, Inc. (SAH): Free Stock Analysis Report
Asbury Automotive Group, Inc. (ABG): Free Stock Analysis Report
O'Reilly Automotive, Inc. (ORLY): Free Stock Analysis Report
BRP Inc. (DOOO): Free Stock Analysis Report
Original post