Forex News and Events
OPEC reach pre-agreement, let’s finalize it now!
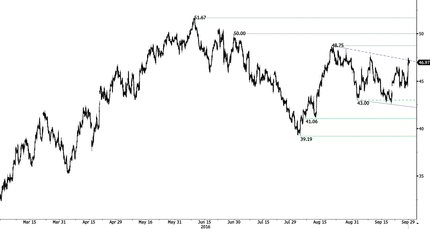
OPEC ministers reached an expected deal yesterday on the sidelines of the International Energy Forum in Algiers. After months of unsuccessful talks, it seems that the members of the intergovernmental organisation are finally reading from the same page. However, it wasn’t a done deal as Iran has been consistently emphasized it wanted to return to pre-sanctions production level, while Saudi Arabia reiterated many times it was ready to back a coordinated production cut but only if Iran cooperates. In our opinion, this is the one and only way to lift up crude oil prices as the supply glut is here to last against the backdrop of a slowing global economy and the continuous development of less energy-intensive technologies.
On the data front, even if the growth in US rig count stabilised over the past few weeks, the momentum is here. The same is true for US crude oil inventories that have been shrinking significantly over the last four weeks; inventories are still flirting with all-time highs. Last week, US stockpiles shrank by 1.9mio barrels to 501.7mio barrels versus an expected increase of 3mio barrel. The drop was however offset by a sharp increase in gasoline stockpile, which suggests that less crude will be refined.
The pre-agreement between OPEC members may be the signal that the market was awaiting for months. Indeed, at first glance, it looks very promising but we remain suspicious as there is nothing binding in the agreement, which is nothing more than a declaration of will. Tight, the oil ministers agreed to cut production to a range of 32.5mio to 33mio barrels a day (in August OPEC production reached 33.69mio barrels a day), but the agreement says nothing about who will take the cut or how it will be divided. Therefore, we remain cautious concerning the effects of an actual trim in production, especially in view of the OPEC’s history of consistently failing to reach a consensus.
Crude Oil


The Risk Today
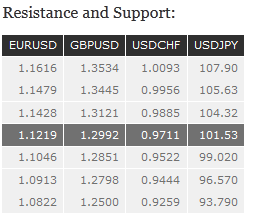
EUR/USD EUR/USD recovery rally has faded below declining trend line at 1.1292. Hourly support is given at 1.1196 (23/09/2016 low). Key resistance is given at 1.1352 (23/08/2016 high) then 1.1428 (23/06/2016 high). Strong support can be found at 1.1046 (05/08/2016 low). Expected to decline towards 1.1100. In the longer term, the technical structure favours a very long-term bearish bias as long as resistance at 1.1714 (24/08/2015 high) holds. The pair is trading in range since the start of 2015. Strong support is given at 1.0458 (16/03/2015 low). However, the current technical structure since last December implies a gradual increase.
GBP/USD GBP/USD is back below 1.300 after a weak attempt at declining trendline. Persistent selling pressure suggests further weakness. Hourly resistance is given at 1.3121 (22/09/2016 high). Key resistance lies at 1.3445 (06/09/2016 high). Hourly support can be found at 1.2947. Expected to show continued downside pressures. The long-term technical pattern is even more negative since the Brexit vote has paved the way for further decline. Long-term support given at 1.0520 (01/03/85) represents a decent target. Long-term resistance is given at 1.5018 (24/06/2015) and would indicate a long-term reversal in the negative trend. Yet, it is very unlikely at the moment.
USD/JPY USD/JPY has broken key resistance at 101.24 opening the way for further strengthen. However, technical pattern remains focused on further downside. Hourly resistance is given at 102.79 (21/09/2016 high) then 104.32 (02/09/2016 high). Psychological support at 100 is not far away. A key support lies at 99.02 (24/06/2016 low). Expected to further weaken. We favor a long-term bearish bias. Support is now given at 96.57 (10/08/2013 low). A gradual rise towards the major resistance at 135.15 (01/02/2002 high) seems absolutely unlikely. Expected to decline further support at 93.79 (13/06/2013 low).
USD/CHF USD/CHF continues to move broadly sideways, as can be seen by the failure to break the hourly resistance at 0.9885 (01/09/2016 high), the short-term technical structure is negative. There are alternating periods of strong and low volatility and the pair seems without direction. Key resistance lies at 0.9956 (30/05/2016 high). Support can be located at 0.9662 (28/09/2016 low) then 0.9662 (26/09/2016 base low). In the long-term, the pair is still trading in range since 2011 despite some turmoil when the SNB unpegged the CHF. Key support can be found 0.8986 (30/01/2015 low). The technical structure favours nonetheless a long term bullish bias since the unpeg in January 2015.

