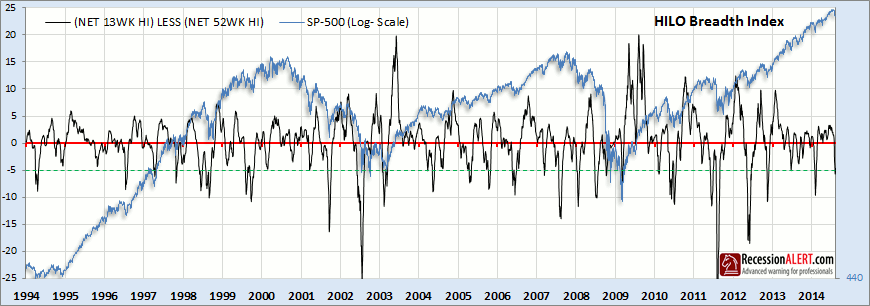
We have spend the better part of a decade in the search for the ultimate indicator for the stock markets. Whilst it became clear early on in this quest that no one indicator would work all the time and every time, there are a few that stand out from the rest. One of them is our HILO Breadth Index which we introduce in this research note. Apart from a multi-decade track record, the HILO index is very adept at warning in advance of protracted corrections/bear markets and for pinpointing market bottoms with very few false positives. This trifecta of features rarely occupy the same podium on most indicators.
On Wednesday August 13th, this indicator rose above -5 from below, a rare occurrence that happens only once every 12 months on average:
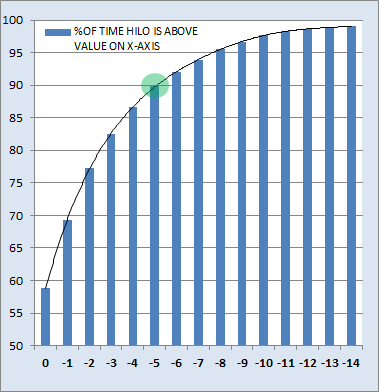
In 80% of the cases when this occurred, magnificent buying opportunities were signaled for investors and traders alike. Looking at the S&P 500 index itself does not hint at a trough worthy of a “once in a year opportunity” title, and yet the breadth index highlights the extent of the recent correction we had. Visitations of the index below -5 are “outlier events” as shown by the chart below:
We see that the index spends 90% of its time above a reading of -5, implying visitations below -5 constitute just 10% of all observations in the last 20 years. The choice of -5 as a trigger for a trough reversal signal is no accident – as you can see from the above chart, the curvature of the distribution at the -5 point represents the “sweet spot” (tangent angle = 45%) beyond which we experience “diminishing returns”. On very rare occasions, the index may dip below -10, which you can see only represents 2% of the historical record.
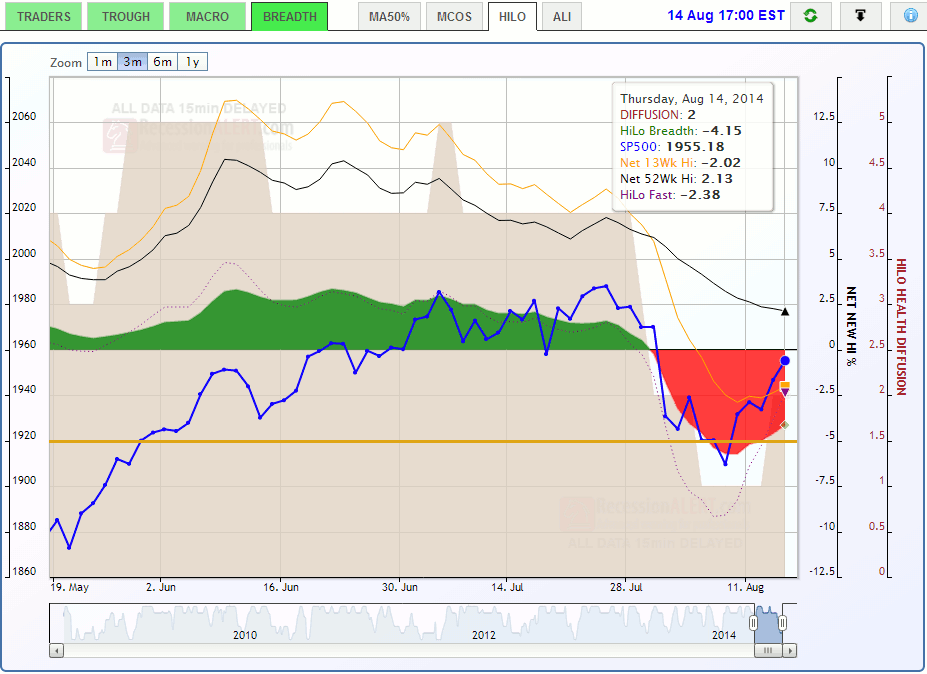
Here is the live chart for subscribers as of yesterday. The HILO Breadth Index is the red and green shaded area, which is merely the difference between the thin orange line (net % of new 13-week highs) and the thin black line (net % of new 52-week highs.) You will note from the chart that the “Diffusion” (brown shaded area) rose from 1 to 2, which is also a good trough signal as mentioned in our research note on this indicator.
IMPORTANT DISCLAIMERS: Although many of our models rely heavily on back-testing, optimisation and probability methods, please note that past performance is NO GUARANTEE for future returns. No system devised by man can predict the future, let alone the future of the markets and economies. What we have are sets of mathematical models that use historical data and varying theories to pinpoint places in time when the STATISTICAL LIKELYHOOD of calling the start and end to recessions is the greatest. In the midst of all the best mathematical models, you can have geo-political events, wars, terrorist attacks, natural disasters and even nuclear accidents that tip everything upside down. This is always a risk factor you need to factor in on any recession call no matter how confident you are in a signal. The SuperIndexes are created through mathematical and statistical optimisation techniques that best fit the historical NBER data. There is no guarantee that out-of-sample performance will match that of prior in-sample performance.
