The US dollar was generally weaker across the board, while the pound powered forward alongside the Aussie dollar which also benefited from an up-tick in commodity prices.
With another quiet one in terms of economic data released, we stay focused on the impact of the impending weekend meetings between oil producing nations in Doha.
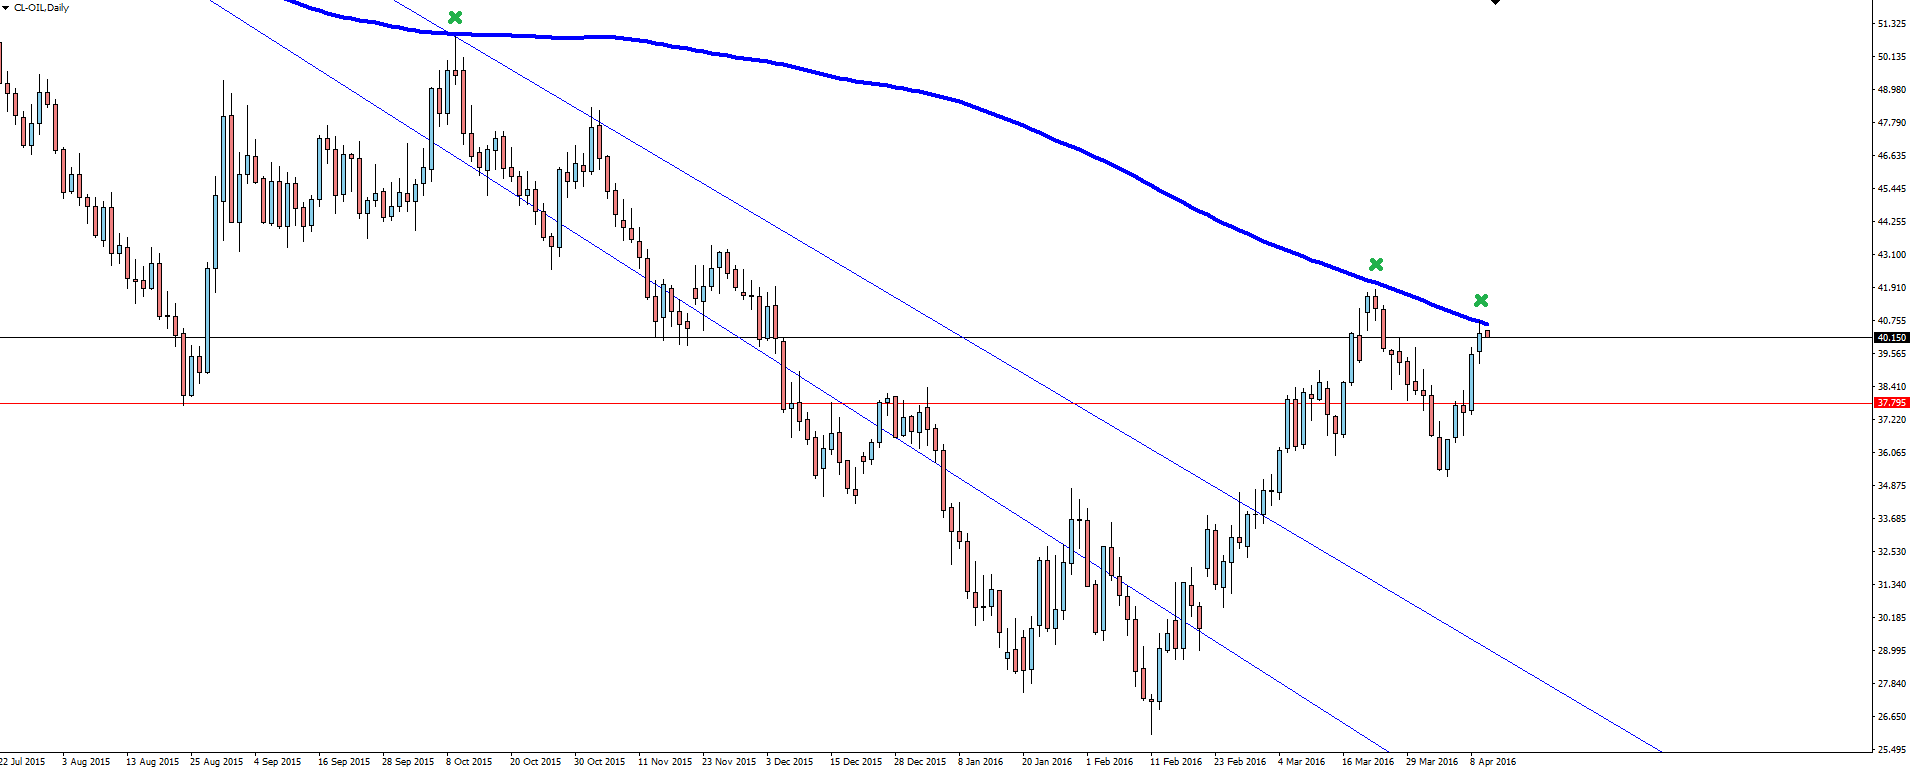
With oil sitting just above the important, psychological $40 per barrel level, it’s still the 200 SMA that is capping price.
Price really went nowhere yesterday in thin, data-less trade. I’m a little surprised by this, and still expect some headline driven volatility as we head into the weekend’s meetings said to focus on the production freeze and $50 per barrel sustainable price target for producers.
Oil Daily:
Click on chart to see a larger view.
Now we’re here, price has to poke its head above the line, doesn’t it…? It’s just one of those seemingly magically magnetic levels that price could be sucked up into ‘just to see what happens’.
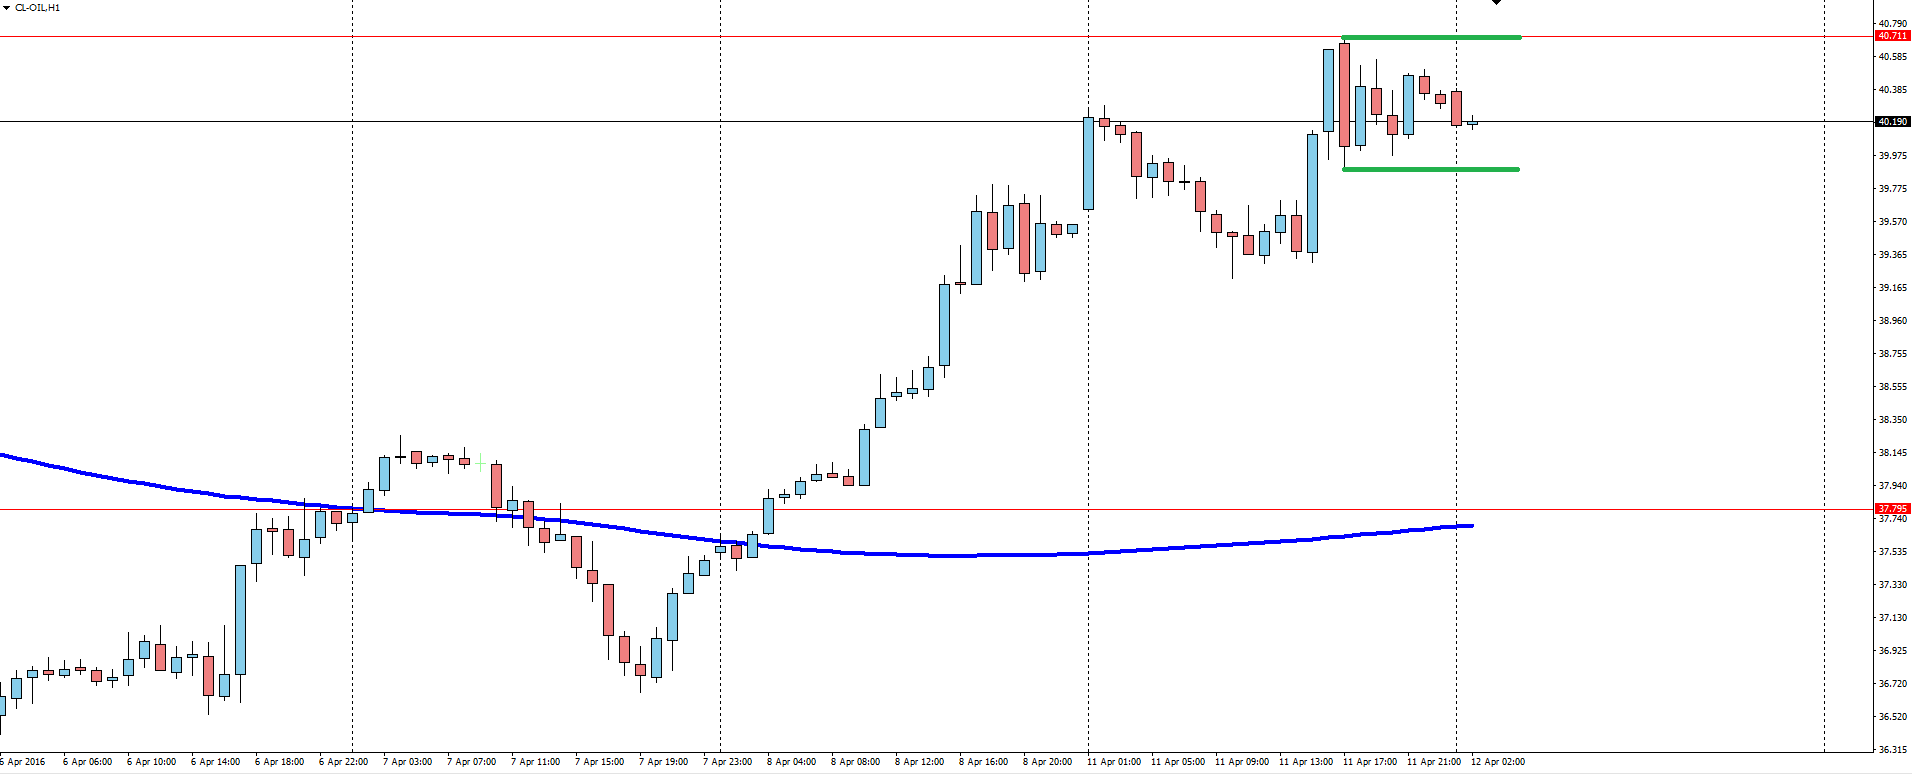
Oil Hourly:
Click on chart to see a larger view.
Zoom into the hourly and the top red line is where the 200 SMA comes in on the daily. Price has tested the level once yesterday, and price is still trapped inside a little inside bar formation.
Coiling up for a breakout?
———-
Chart of the Day:
When we look at oil, it’s always wise to then flick over to the USD/CAD chart.
We took a look at a USD/CAD trading scenario in last Friday’s Daily Market Update and today’s chart of the day section is a little follow up on what the level is now doing.
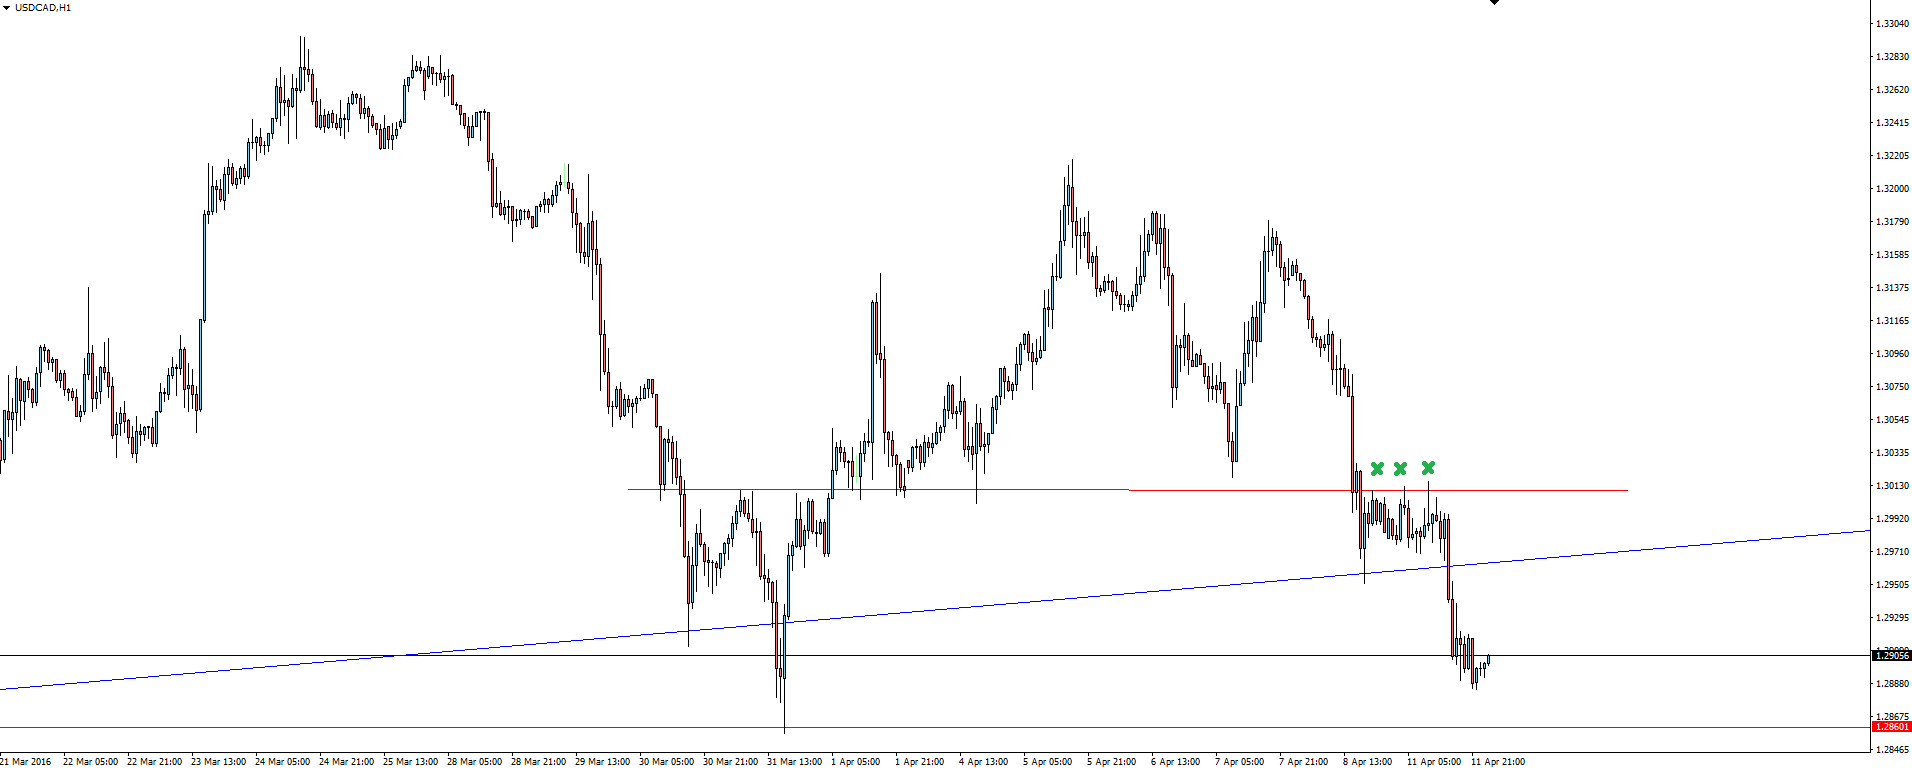
USD/CAD Hourly:
I’ve left the red line we were talking about managing our risk around last week on this chart and as you can see, the level again saw price react. This time however, on the opposite side as resistance rather than support.
The blue trend line is drawn off the weekly chart, which makes any break on the lower time frame, much less convincing. I like referring back to this AUD/USD weekly trend line post which highlights the subjectivity of longer term trend lines on the lower time frames, as it’s an important concept to grasp if you’re watching these major levels.
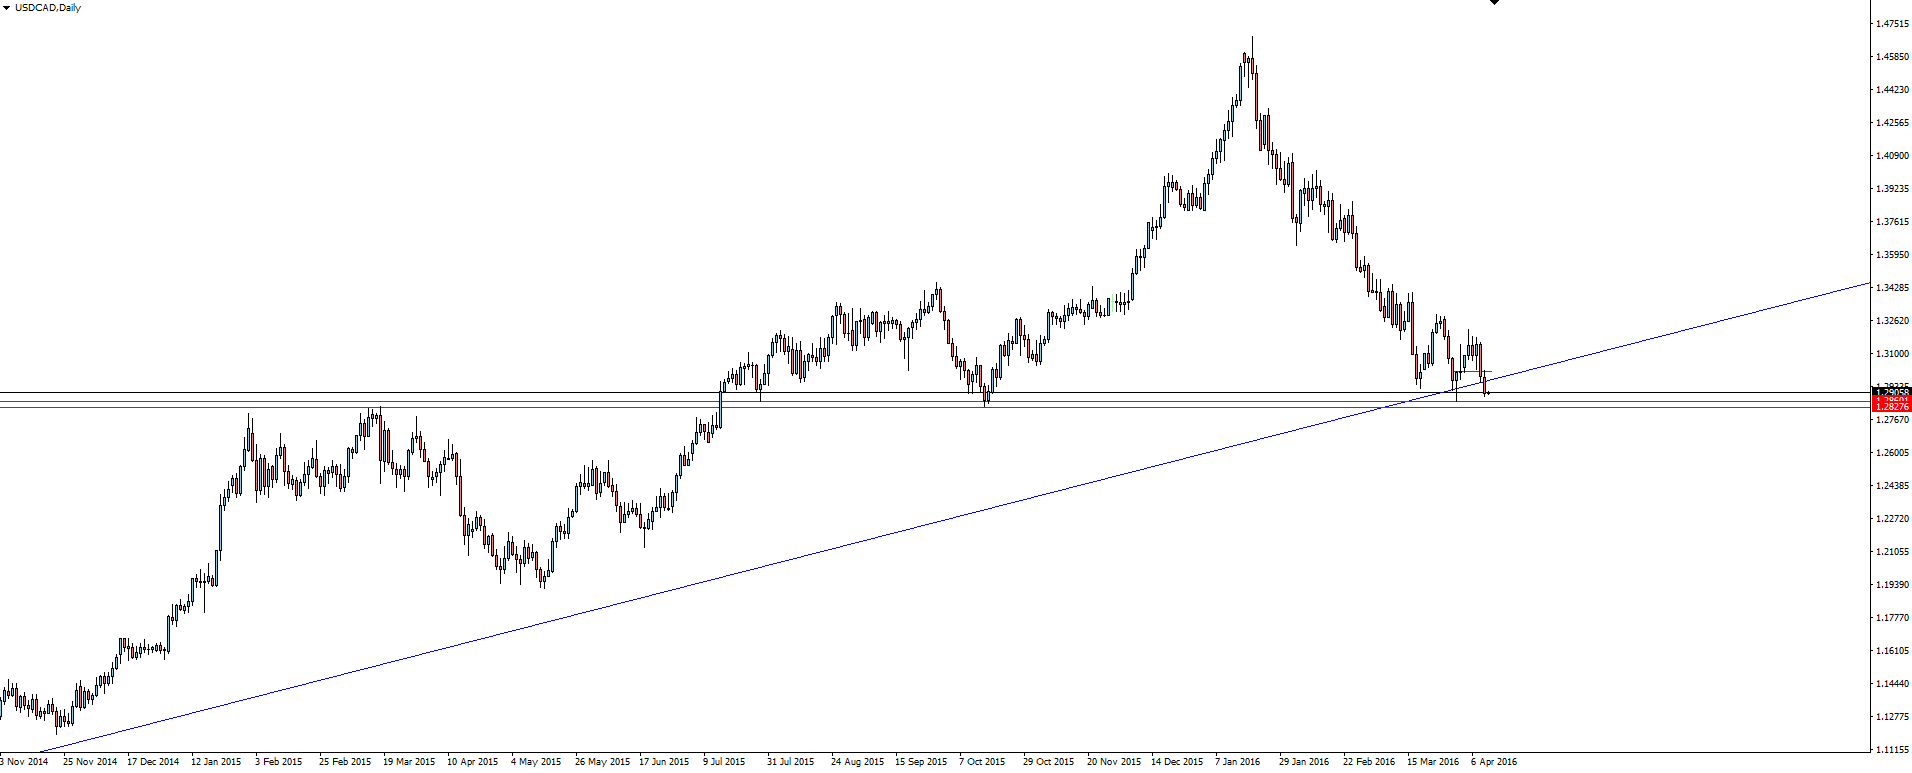
USD/CAD Daily:
Zoom out to the daily chart and you can see the longer term trend line in question much clearer.
Really thought, it’s all about that horizontal support/resistance level which price has reacted off in both directions.
All eyes stay on the correlation between the CAD and oil heading into this weekend’s production freeze talks in Doha between major Oil producing nations.
On the Calendar Tuesday:
AUD NAB Business Confidence
GBP CPI y/y
GBP PPI Input m/m
GBP RPI y/y
USD Import Prices m/m
Risk Disclosure: In addition to the website disclaimer below, the material on this page prepared by Vantage FX Pty Ltd does not contain a record of our prices or solicitation to trade. All opinions, news, research, prices or other information is provided as general news and marketing communication – not as investment advice. Consequently any person acting on it does so entirely at their own risk. The experts writers express their personal opinions and will not assume any responsibility whatsoever for the actions of the reader. We always aim for maximum accuracy and timeliness, and Australian Forex Broker Vantage FX on the MT4 platform, shall not be liable for any loss or damage, consequential or otherwise, which may arise from the use or reliance on this service and its content, inaccurate information or typos. No representation is being made that any results discussed within the report will be achieved, and past performance is not indicative of future performance.l
