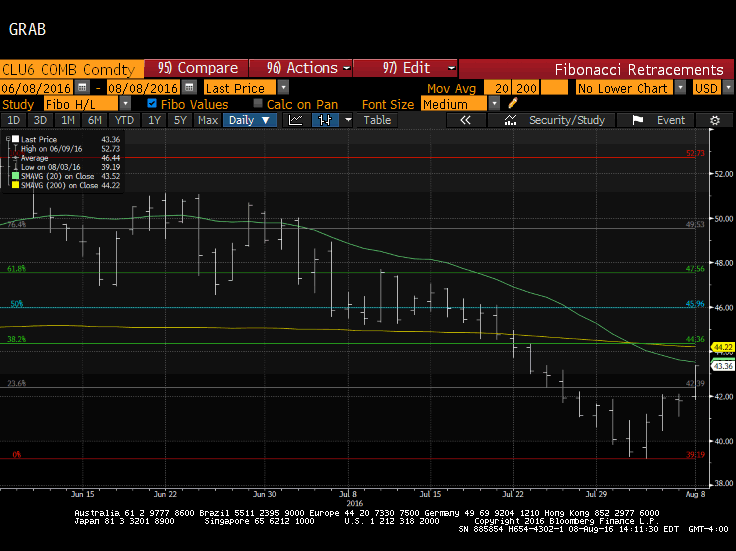
This Great Graphic from Bloomberg shows the September light sweet crude-oil futures contract since peaking in early June near $52.75. It reached a low last week of about $39.20.
The turn last week came on news that although oil inventories rose, gasoline inventories fell dramatically. The recovery seemed to have stalled at the end of last week near $42.40 but was given a new lease on life by reports of an OPEC meeting next week. OPEC President Al-Sada (Qatar) seemed to try to make the most of the informal meeting.
Speculation that it may reach an agreement to freeze output or re-introduce quotas seems a stretch, though of course the usual advocates, like Venezuela and Ecuador, are still pushing their case. Saudi Arabia has argued that it is willing to freeze output if others do so too.
This puts the onus on Iran. Iran's output has risen by about 180k barrels since April and about 600k barrels since the embargo was lifted. Its production is near 3.6 mln barrels a day. Before the sanctions, it was producing 4.0-4.2 mln barrels a day. Assuming rational-actor model, it seems unreasonably optimistic that Iran would participate in an agreement that would not allow it to return to the status-quo ante.
That means an agreement at the year-end OPEC meeting may be a more likely time frame, but even then it may be a stretch. Lingering US sanctions, companies wanting to avoid the situation entirely and the existence of alternatives have slowed Iran's efforts to boost output quicker.
The chart below shows that September light sweet crude oil is nearing its 20-day moving average (~$44.20). It has not closed above this moving average since June 29. Above, there's the 200-day moving average (~$44.20) and the 38.2% retracement of the two-month decline (~$44.35).

Meanwhile, the US rig count continues to recover. The oil rig count bottomed in late May at 316. In the following ten weeks, the rig count rose in all but one week. Baker-Hughes reported last week that its rig count stands at 381, the largest since March. We recognize that there may be a seasonal factor in the works. In July and August 2015, the rig count rose eight of nine weeks.
In other developments, Libya has begun maintenance work at its largest oil export terminal. US trade figures show US oil exports are falling and imports are rising. China's trade figures showed crude imports fell to six-month lows, while net fuel exports surged to a record. Saudi Arabia cut prices to Asia.
This week, the early call for the mid-week EIA report is for a million barrel decline in oil inventories -- following a 1.4 mln barrel build in the previous week. Gasoline inventories are expected to fall by 1.4 mln barrels after a 3.2 mln barrel draw-down previously.
