Get 40% Off
🚨 Volatile Markets? Find Hidden Gems for Serious Outperformance
Find Stocks Now

Oil Prices Poised For Further Losses

Published 06/02/2017, 06:32 AM

Key Points:

  • Oil’s technicals are looking rather grim.
  • The commodity seems to be shrugging off fundamental developments.
  • The $45 handle could now be in the crosshairs for the bulls.

Oil prices could be in trouble moving forward as they seem to have shrugged off both renewed commitments from OPEC and a 6.43M barrel draw in US inventories. This could be, in part, a result of the technical bias which is looking fairly dour going ahead. Indeed, current readings are suggesting that we could see the commodity retreat to the $45 mark within a fairly short timeframe.

More precisely, whilst we are currently seeing oil hover above a robust support level at 47.70, there is growing evidence to suggest further losses are now warranted. For one thing, we can see that the 12 and 20 day moving averages have just completed a bearish crossover and the overall EMA bias is now in highly bearish. Furthermore, the MACD and signal line have also experienced a crossover – a sign that oil prices are predisposed to a tumble in the coming days.
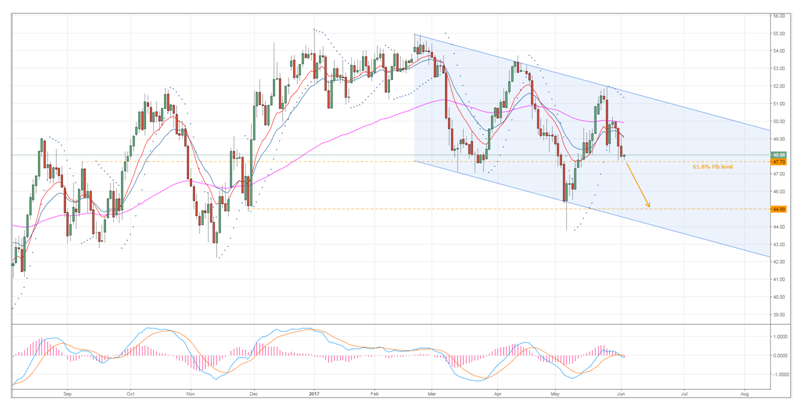
Oil Chart

If we take a closer look at a number of other technical indicators, the story remains largely consistent with the EMA bias. Notably, the Parabolic SAR is still well and truly above price action and is, therefore, signalling that a continuation of the downtrend is likely to occur. Moreover, a decline back to the downside of the bearish channel would be in line with the regression trend analysis which continues to suggest downside risks are abundant.

3rd party Ad. Not an offer or recommendation by Investing.com. See disclosure here or remove ads .

Speaking of the channel, the structure highlighted in the above chart represents a near-term cap on downsides but we may see a reversal prior to an actual challenge to the lower constraint. Specifically, the $45 handle should hold as a support zone given that there is a historical zone of support around this price. Additionally, both stochastics and RSI would be deeply oversold around this price if oil tumbles at its current pace which will be worth keeping in mind.

Ultimately, the future isn’t looking too buoyant for oil prices and it’s only likely to get worse unless OPEC members can pull something major out of their collective hats. However, do keep an eye on the North American rig count data as, if the uptick in active rigs begins to slow, this could help to give some credence to OPEC’s cuts – potentially saving the embattled commodity from sinking much further.

Latest comments

Your chart and Favio Poci's chart on oil is VERY DIFFERENT. Oil went down to low $ 47 and bounced back later on in the high $ 47 range....I see bullish trend on Poci's chart and bearish on yours. Please guys I understand the complexities of oil dynamics that's why we rely on you for sound interpretation of its price action. I am so confused! Help!!
Thanks for sharing
Hey Blackwell Global.. Thank you very much for sharing with me, i will share this analysis in my network. I hope you all are having a great day:-)
Yeah... No Position in Market ... So, having a great time !!! :)
Risk Disclosure: Trading in financial instruments and/or cryptocurrencies involves high risks including the risk of losing some, or all, of your investment amount, and may not be suitable for all investors. Prices of cryptocurrencies are extremely volatile and may be affected by external factors such as financial, regulatory or political events. Trading on margin increases the financial risks.
Before deciding to trade in financial instrument or cryptocurrencies you should be fully informed of the risks and costs associated with trading the financial markets, carefully consider your investment objectives, level of experience, and risk appetite, and seek professional advice where needed.
Fusion Media would like to remind you that the data contained in this website is not necessarily real-time nor accurate. The data and prices on the website are not necessarily provided by any market or exchange, but may be provided by market makers, and so prices may not be accurate and may differ from the actual price at any given market, meaning prices are indicative and not appropriate for trading purposes. Fusion Media and any provider of the data contained in this website will not accept liability for any loss or damage as a result of your trading, or your reliance on the information contained within this website.
It is prohibited to use, store, reproduce, display, modify, transmit or distribute the data contained in this website without the explicit prior written permission of Fusion Media and/or the data provider. All intellectual property rights are reserved by the providers and/or the exchange providing the data contained in this website.
Fusion Media may be compensated by the advertisers that appear on the website, based on your interaction with the advertisements or advertisers.
© 2007-2024 - Fusion Media Limited. All Rights Reserved.