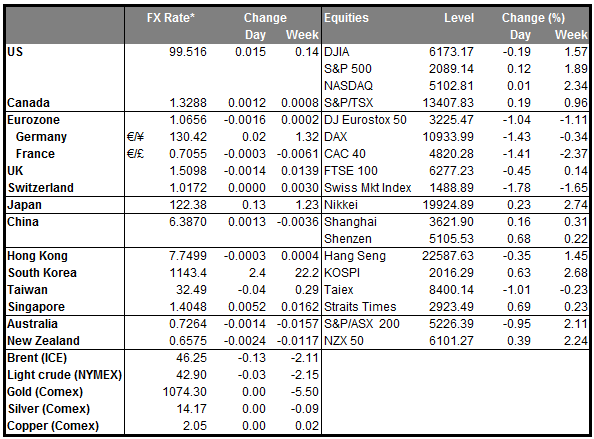
• Oil prices jump on surprise Saudi-Russian meeting Oil prices rose during the Asian session, on news that the energy ministers of Saudi Arabia and Russia are scheduled to meet in Qatar today to discuss oil production. OPEC delegates have stated in the past that Saudi Arabia would be willing to consider production cuts only if joined by other major non-OPEC producers. The news sparked speculation of a potential agreement among the two nations to control production and added more fuel in the recent recovery of oil prices. OPEC officials have floated the idea of a production ‘freeze’ in recent days, which means that members will keep pumping their current levels of output. This could stabilize the supply side of the energy market as overproduction was the main driver behind the plunge in oil prices. Iran remains the wild card in this outlook, as the country has repeatedly stated its intention to increase oil exports in order to recover its lost market share. Nevertheless, any potential agreement between Saudi Arabia and Russia to regulate oil supply could bring a halt to the free fall of oil prices and could eventually cause a brief recovery, at least in the near term.
• RBNZ under pressure to ease The kiwi fell by approximately 0.7% against its US counterpart overnight, as New Zealand’s 2-year inflation expectations plunged to their lowest level in more than two decades. The country is already facing very low inflation, with many market participants worried for a slip into deflation. Lower inflation expectations may result in weaker wage negotiations or lower goods prices, which could lower actual inflation. At its last meeting, the RBNZ remained on hold but signaled that further easing may be required to ensure accelerating inflation. Given the plunge in inflation expectations, we believe that the RBNZ may now be forced to ease policy further at its March meeting. This could bring NZD under renewed selling pressure.
• Draghi: ECB won’t hesitate to boost stimulus During his quarterly appearance before the European parliament, the ECB President stated yesterday that the Bank won’t hesitate to boost its stimulus program in March if it judges that the recent financial turbulence or the fall in oil prices may weigh further on stubbornly low inflation. The ECB chief acknowledged the risks around Eurozone’s outlook but also said the Bank’s stimulus had worked a lot, with the asset purchase program flexible enough to adapt. The euro came under renewed selling pressure during the speech and given the significant increase in expectations for further easing, we could see the currency extending some of its recent losses.
• Today’s highlights: During the European day, the main event will be the UK CPI for January. The forecast is for a slight acceleration in the headline figure, but a minor slowdown in the core reading, which reflects energy-related base effects. The decline in gasoline prices in January was less than it was last year, which could provide a temporary boost to inflation due to the CPI calculation. In the minutes of the latest BoE meeting, officials judged that CPI inflation is likely to remain below 1% until the end of the year, as a result of the recent fall in commodity prices. Therefore, we believe that a minor rise in the inflation rate due to base effects may be not be enough to boost inflation expectations, as it may be viewed as temporary. As a result, the market reaction on GBP at the release may be minimal.
• From Germany, the ZEW survey for February is forecast to show a decline in both the current situation and the expectations indices. It appears that the negative sentiment that has recently overwhelmed the global economy may have weighed on the optimism of German investors as well. If this uncertainty begins to affect the investment plans of businesses, it may dampen overall economic growth. This could put the common currency under renewed selling pressure.
• From Norway, we get the GDP data for Q4. Although there is no forecast available, we expect economic growth to have slowed in Norway. The fall in oil priced during the quarter is possible to have hurt export revenues and well as total investments in the energy sector, dragging down the country’s growth rate. A disappointing print could cause NOK to give back some of the gains it posted against its US counterpart since the beginning of the year.
• In the US, the Empire State manufacturing index for February is expected rise but to stay below the zero mark. This still points to contraction in New York’s manufacturing activity and increases the possibilities for another print below 50 in the ISM manufacturing PMI for the same month due to be released on the 1st of March. The NAHB housing market index for the same month is expected to have remained unchanged.
• Canada’s manufacturing sales are expected to have slowed in December, but this is usually not a major market mover.
• We have two speakers scheduled for Tuesday: Philadelphia Fed President Patrick Harker and Minneapolis Fed President Neel Kashkari.
The Market
EUR/USD hits support at 1.1125
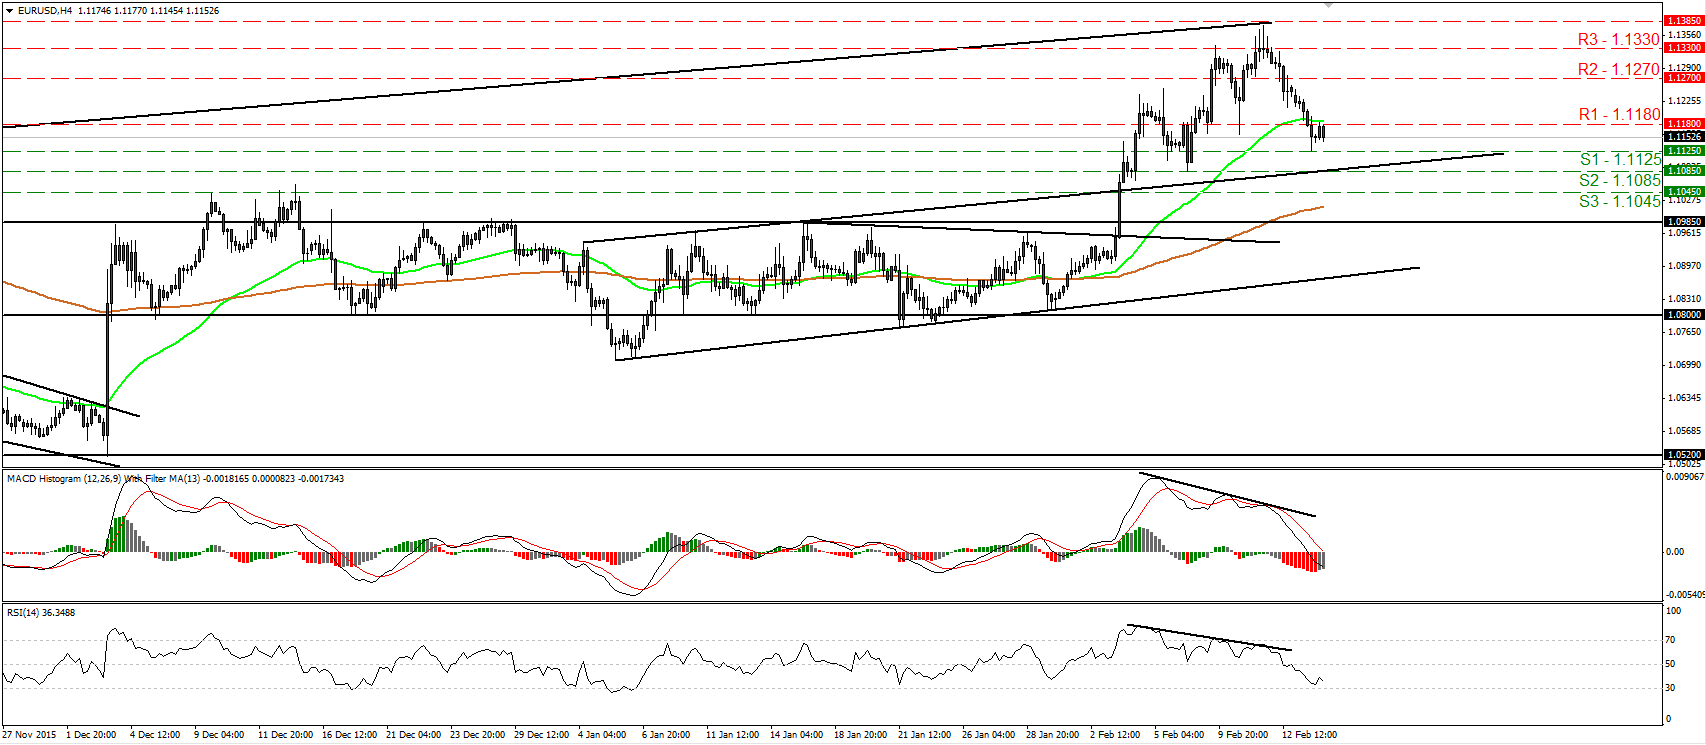
• EUR/USD traded lower on Monday but the decline was halted at 1.1125 (S1). Then, the rate rebounded somewhat to hit resistance at 1.1180 (R1). Given that on the 3rd of February the pair emerged above the 1.0985 hurdle, which is the upper bound of the sideways range it had been trading since December, I still see the likelihood for the pair to turn up again at some point. However, for now I believe that the retreat started on the 11th of February is possible to continue a bit more. A clear dip below 1.1125 (S1) could aim for our next support of 1.1085 (S2) and the prior upside resistance line taken from the peak of the 4th of January. Our short-term oscillators support the notion as well. The RSI has turned down again and could be headed towards its 30 line soon, while the MACD stands below both its zero and trigger lines. Switching to the daily chart, I see that the rate started sliding after it hit the prior upside support line taken from the low of the 13th of March 2015. This is another reason that amplifies the case for further retreat in the near term. However, as long as EUR/USD is trading between the 1.0800 key zone and the psychological area of 1.1500, I would keep the view that the broader trend remains sideways.
• Support: 1.1125 (S1), 1.1085 (S2), 1.1045 (S3)
• Resistance: 1.1180 (R1), 1.1270 (R2), 1.1330 (R3)
USD/JPY breaks above 114.20
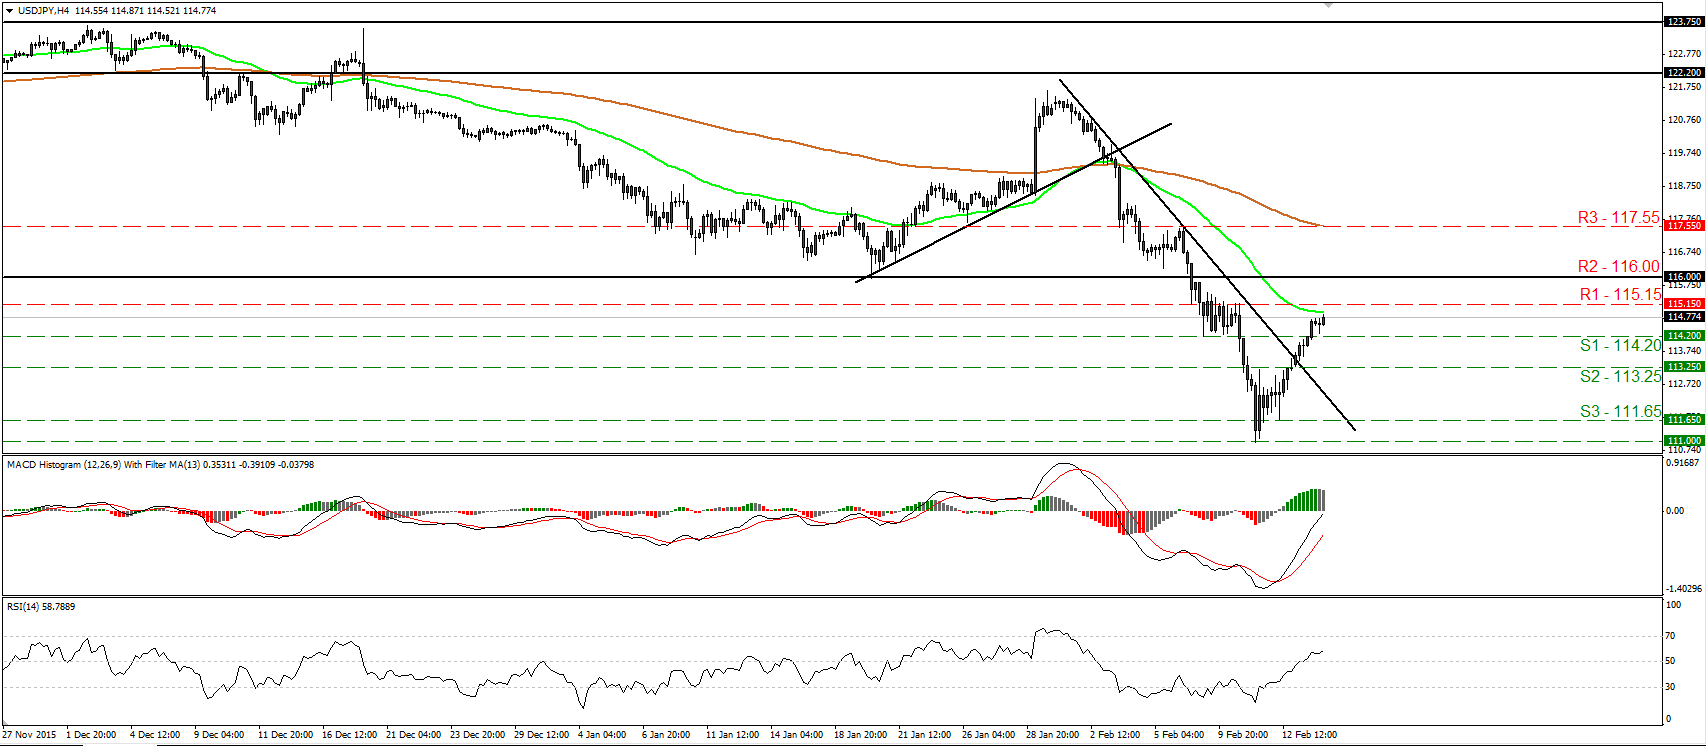
• USD/JPY continued trading higher on Monday, breaking above the resistance (now turned into support) barrier of 114.20 (S1). Bearing in mind that the rate is trading above the prior short-term downtrend line, I would expect the positive wave to continue. The bulls are now headed for a test at the 115.15 (R1) line, where a clear break is possible to challenge the key zone of 116.00 (R2) as a resistance this time. Shifting my attention to our momentum indicators, I see that the RSI emerged above its 50 line, while the MACD stands above its trigger line and looks able to turn positive any time soon. These studies reveal upside momentum and corroborate my view for further near-term advances. As for the bigger picture, I still believe that the close below 116.00 (R2) has turned the longer-term outlook negative. As a result, I would see the recovery from 111.00, or any extensions that stay limited below 116.00 (R2), as a corrective phase for now.
• Support: 114.20 (S1), 113.25 (S2), 111.65 (S3)
• Resistance: 115.15 (R1), 116.00 (R2), 117.55 (R3)
GBP/USD looks ready to exit a triangle
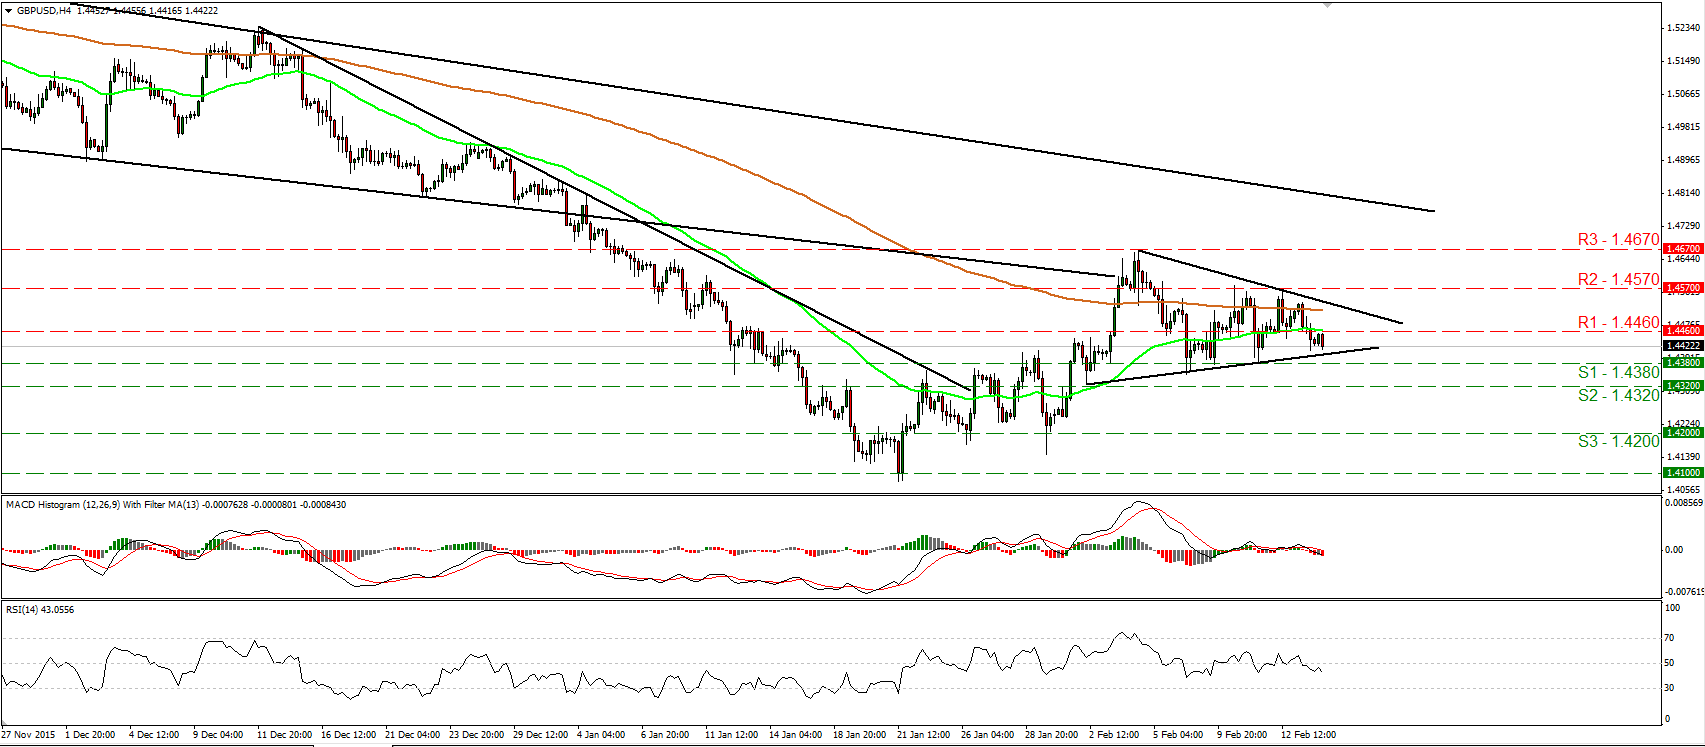
• GBP/USD traded lower yesterday and fell below the support (now turned into resistance) zone of 1.4460 (R1). The rate now looks to be headed towards the lower bound of a triangle formation that has been containing the price action since the 2nd of February. A clear break below 1.4380 (S1) is likely to confirm the exit from the pattern and could initially target the 1.4320 (S2) support line. Our short-term oscillators have just entered their bearish territories, supporting the case. The RSI fell below its 50 line, while the MACD has just crossed below its trigger line and turned negative. In the bigger picture, the price structure remains lower peaks and lower troughs below the 80-day exponential moving average, which is pointing down. Thus, I still see a negative longer-term picture and I would treat the 21st of January – 4th of February recovery as a corrective phase for now.
• Support: 1.4380 (S1), 1.4320 (S2), 1.4200 (S3)
• Resistance: 1.4460 (R1), 1.4570 (R2), 1.4670 (R3)
Gold falls below 1200
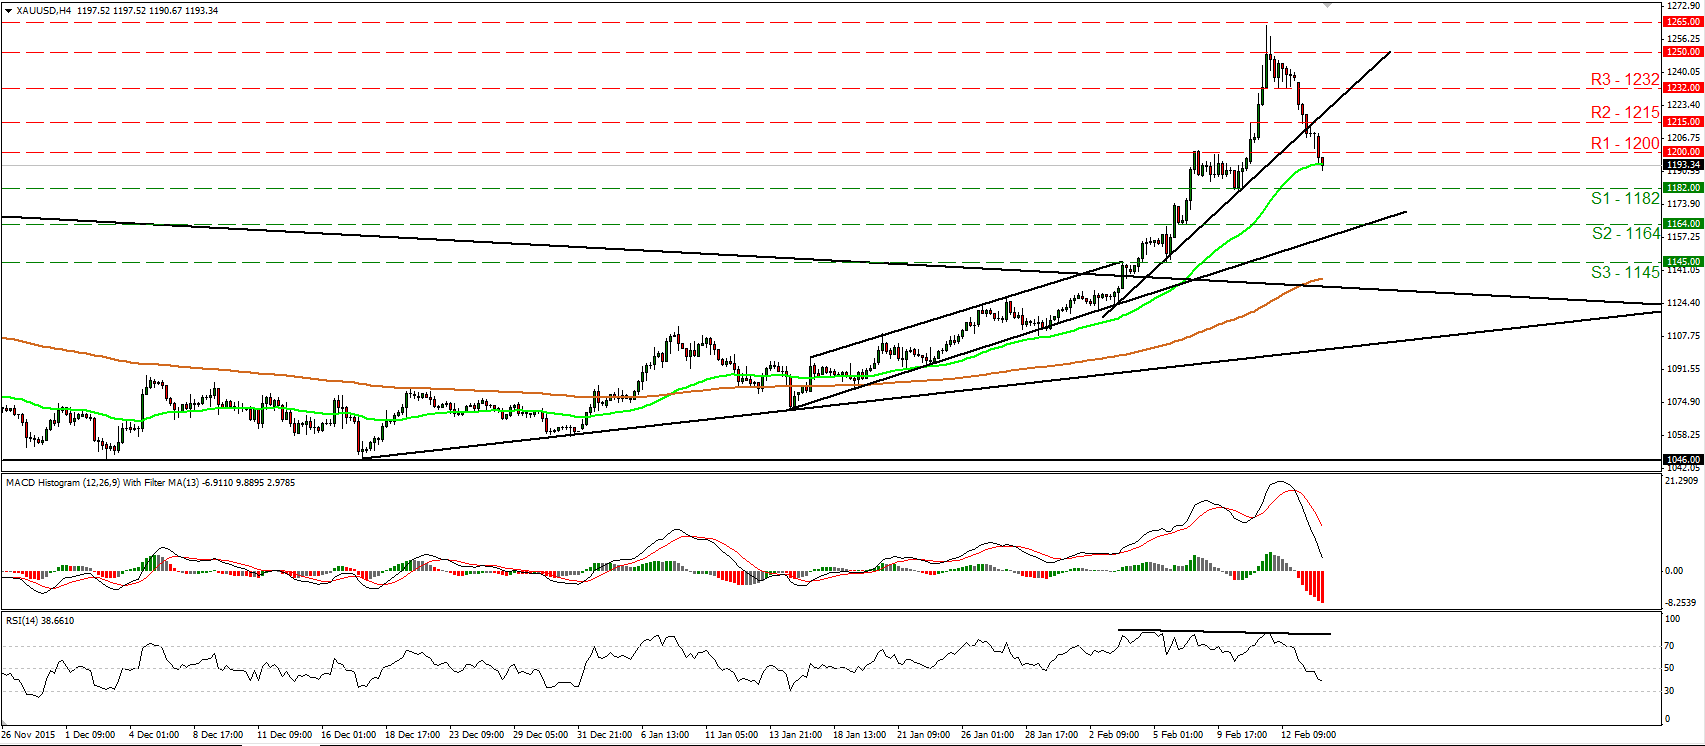
• Gold continued its tumble on Monday, breaking below the short-term uptrend line taken from the low of the 3rd of February. Then, the pair fell below the psychological zone of 1200 (R1). These technical facts have turned the short-term picture somewhat negative in my view and as a result, I would expect the current setback to extend more. I believe that the bears could initially aim for the 1182 (S1) support zone, where a clear dip is possible to open the way for the 1164 (S2) line. Our short-term oscillators detect downside speed and magnify the case that the metal is poised to continue south. The RSI crossed below its 50 line, while the MACD, already below its trigger line, points down and is headed towards zero. Switching to the daily chart, I see that on the 4th of February, the price broke above the long-term downside resistance line taken from the peak of the 22nd of January 2015. As a result, I would consider the medium-term outlook to be cautiously positive and I would treat any further near-term declines as a corrective phase for now.
• Support: 1182 (S1), 1164 (S2), 1145 (S3)
• Resistance: 1200 (R1), 1215 (R2), 1232 (R3)
WTI breaks above 30.50
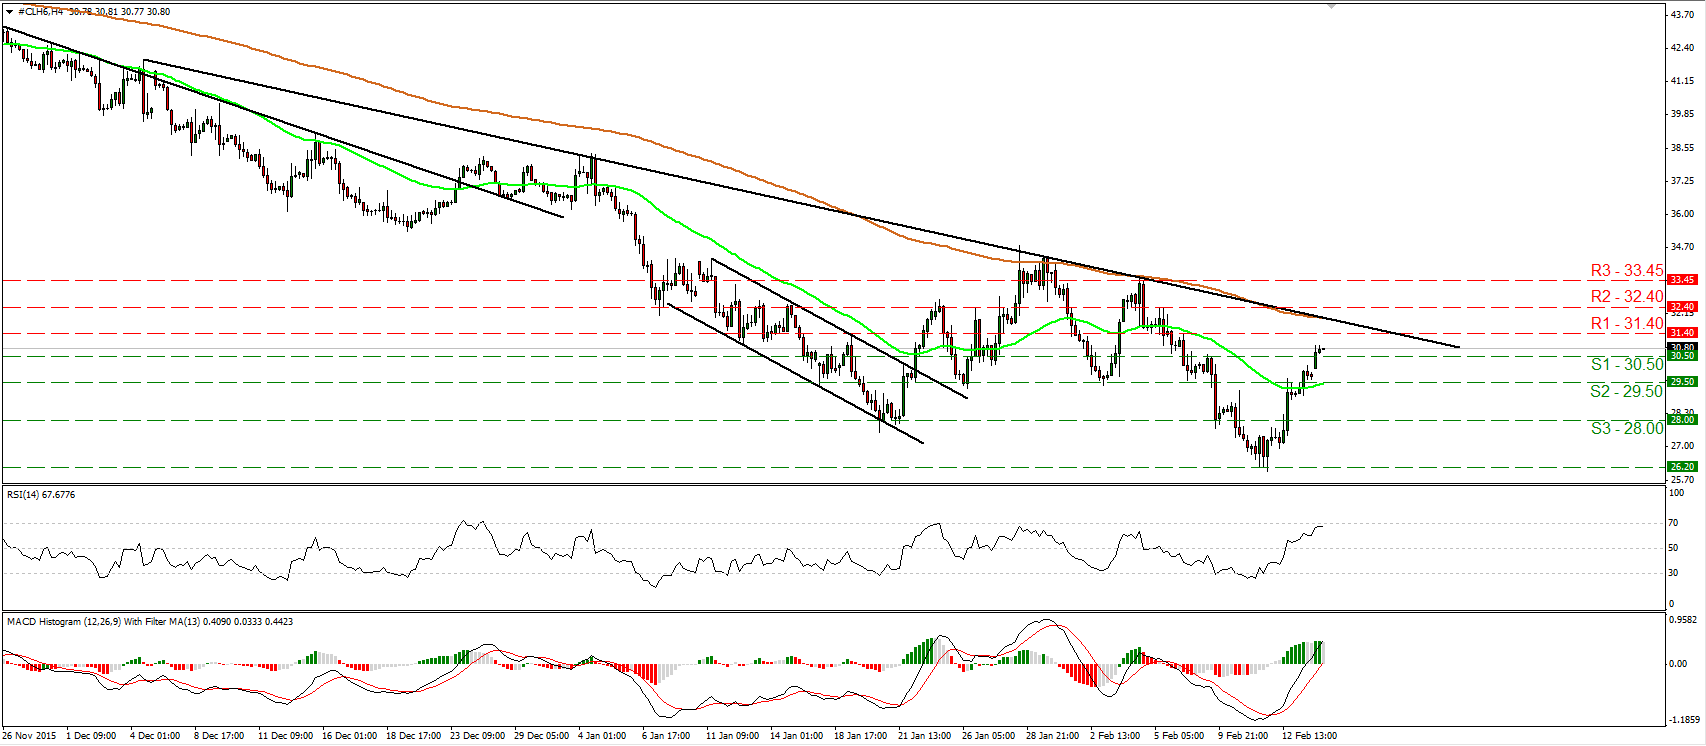
• WTI continued trading higher on Monday and today during the Asian morning, it managed to emerge above the 30.50 (S1) line. Nevertheless, given that the price is still trading below the downtrend line taken from the 4th of December, I would consider the outlook to stay negative. I would like to see a clear close above that trend line before I get confident on more bullish extensions. Taking a look at our oscillators, I see that the RSI continued higher and now looks ready to challenge its 70 line, while the MACD stands above both its zero and trigger lines. These indicators support that WTI could continue north for a while, at least to test the aforementioned downside resistance line. On the daily chart, I see that WTI has been printing lower peaks and lower troughs since the 9th off October. Therefore, I would treat the recovery started on Thursday, or any extensions of it, as a corrective move for now.
• Support: 30.50 (S1), 29.50 (S2), 28.00 (S3)
• Resistance: 31.40 (R1), 32.40 (R2), 33.45 (R3)


