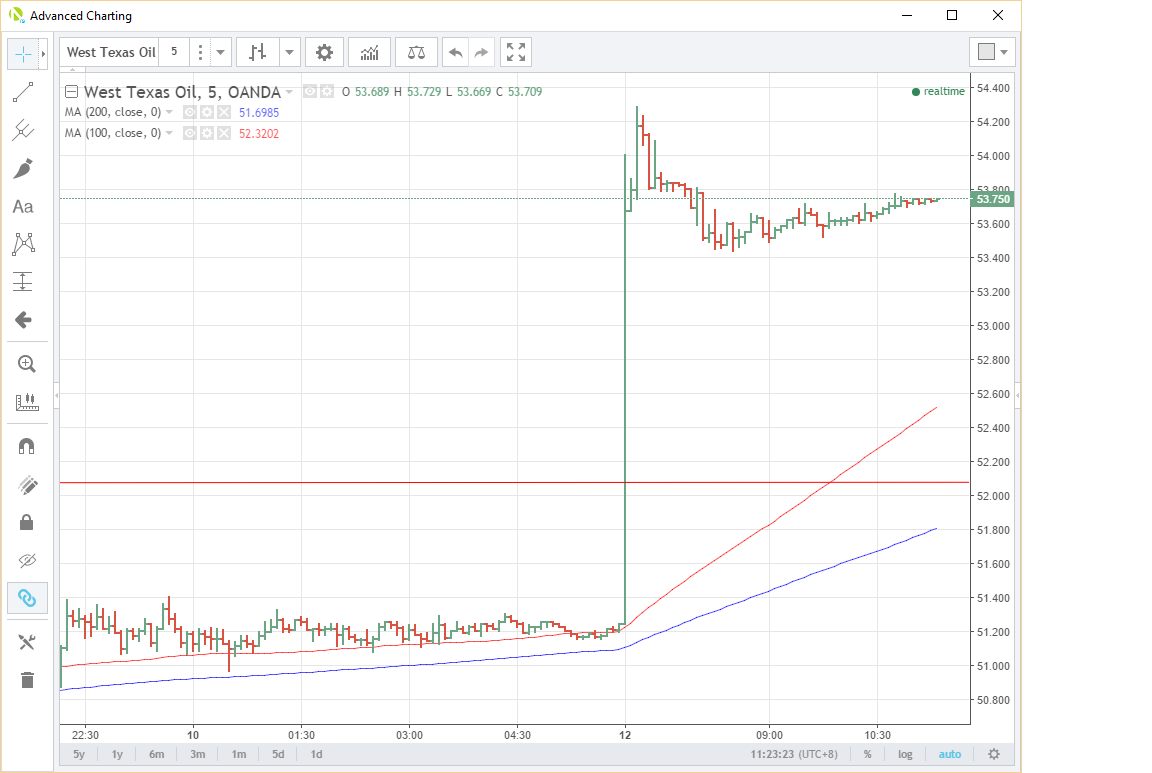
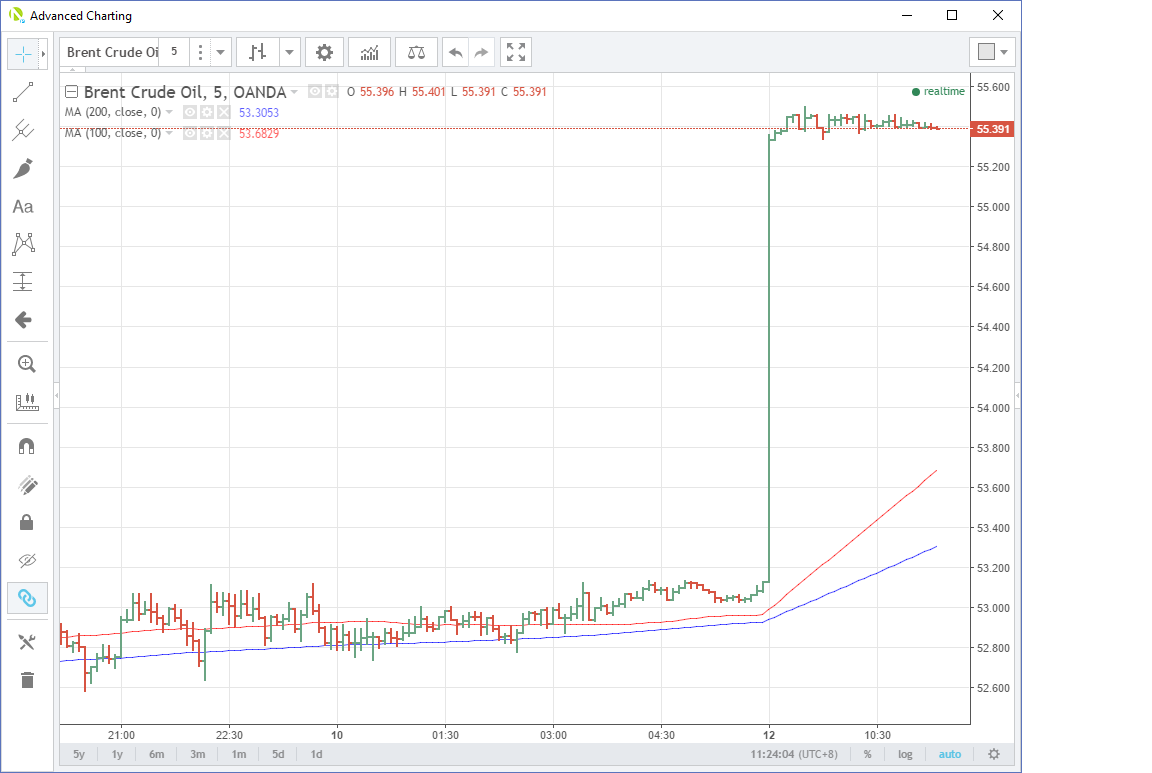
An exciting morning as both West Texas Intermediate (WTI) and Brent Crude leapt five percent in early trade following this weekend’s signing of the OPEC/NOPEC production cuts.
OPEC and Non-OPEC (NOPEC) continue pulling rabbits out of the hat with a smooth signing of the joint production cut agreement with no last minute hitches. Russia and Saudi have taken the bulk of the cuts which will slice 1.5million barrels per day of production for six months, with the possibility it can be renewed for another six months after that.
No doubt compliance or not will rear its ugly head in the future. As will US Shale’s potential impact as oil heads North. WTI opened at 6 am Singapore and immediately jumped from Friday’s close around $51.40 to $54.15 a barrel.

Brent opened three hours later and followed suit, jumping to $55.40 a barrel from a New York close of $53.10. WTI has since pulled back to $53.70 a barrel while Brent has maintained all its gains. This likely reflects the three-hour difference in their respective opening times on the futures.

I am always cynically suspicious of large directional moves in Asia on currencies and commodities early on a Monday morning. Typically they tend to be incorrect and retrace most if not all by the London opening. This feels a little different in all honesty. Both contracts are holding well which makes me think that a lot of speculative longs were closed out into the weekend. Thus the market was not positioned for this spike and has had to chase it higher. This could imply the move could have more legs although I would expect the shale producer hedging (selling futures) to increase to a frenzy at these levels. This could take some of the momentum wind from WTI’s sales. It will be interesting to see their reaction.
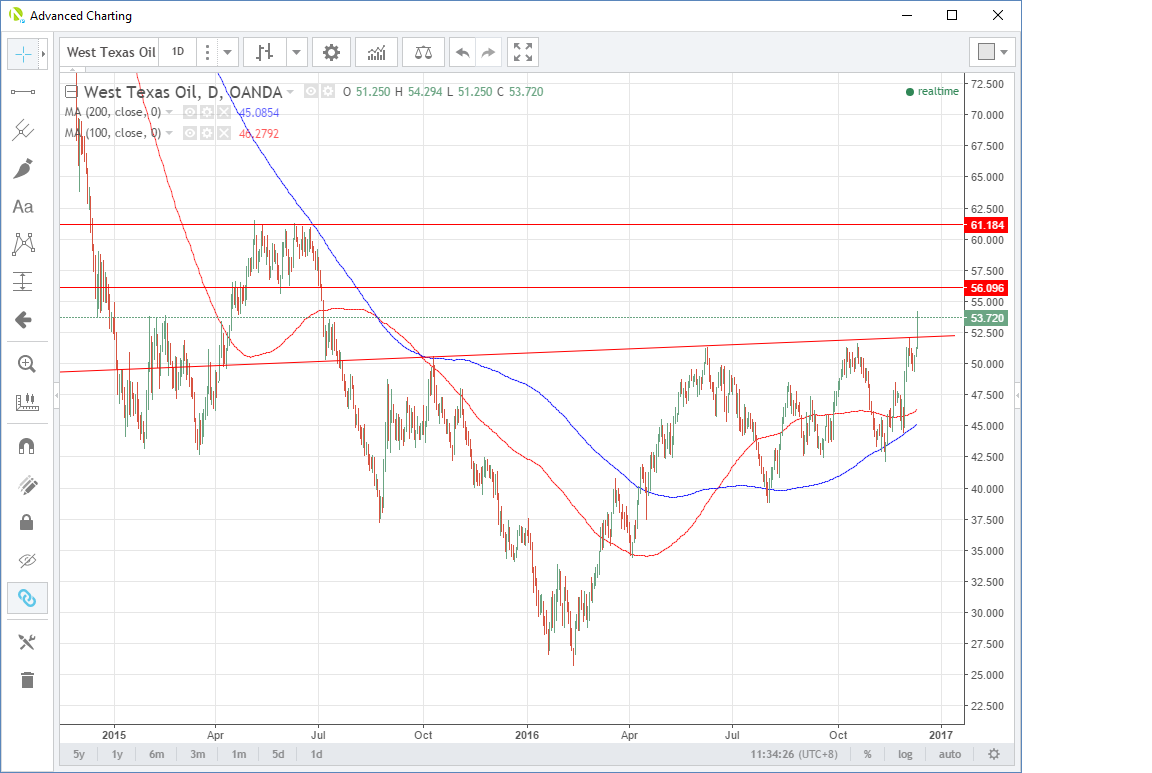
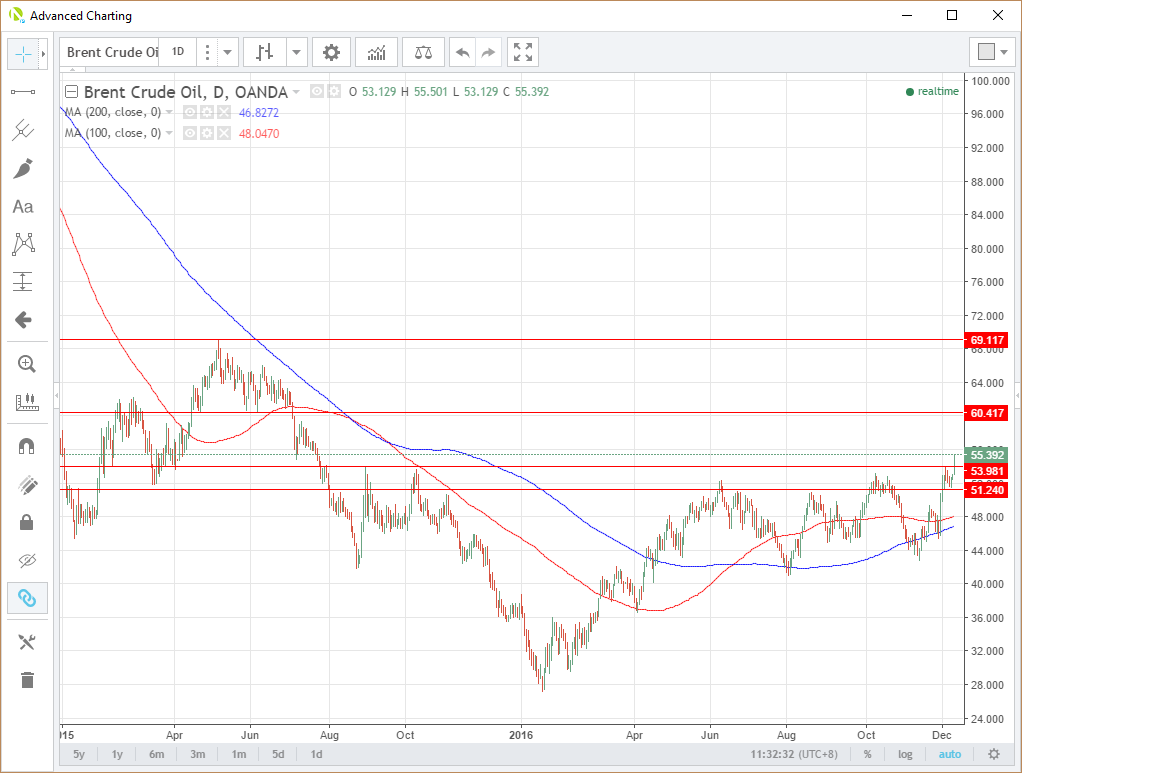
Looking at the daily charts…
WTI (spot basis)
Has exploded through long-term resistance at $52.10 which now becomes support. Resistance appears in a series of 2015 previous daily lows at $56.10, and then the May/June 2015 highs at $61.20. The later looks like a formidable level on the chart.

Brent (spot basis)
Like WTI, Brent broke resistance at $54.00 this morning, and this becomes support with last week’s lows at $51.25 behind. Daily resistance sits at a series of daily lows and congestion around $60.40 before the May 2015 high at $69.10.

As mentioned other factors such as compliance and shale will have their part to play in the days and weeks to come. But for oil bulls, the early price action certainly looks constructive. Time will tell …
This article is for general information purposes only. It is not investment advice or a solution to buy or sell securities. Opinions are the authors; not necessarily that of OANDA Corporation or any of its affiliates, subsidiaries, officers or directors. Leveraged trading is high risk and not suitable for all. You could lose all of your deposited funds.
