Talking Points: - Oil consolidated in early Asia trade after Brent plunged below $50
- Copper weighed by a weak Caixin China Manufacturing PMI
- Gold and precious metals dragged by commodities selling
The Caixin China Manufacturing PMI missed expectation and disappointed the market at 47.8, lower than 48.2 in the previous month. The data amplified Chinese growth concerns after an unimpressive official Manufacturing PMI last Saturday and led to broad selling in commodities.
The deal to curb Iran’s nuclear program in return for lessen sanctions reportedly won further support from the Gulf Arab monarchies, which would bolster chances for a U.S. Congressional approval. Iran’s vow to speed up oil production within a short time of sanction lift could exacerbate the current supply glut.
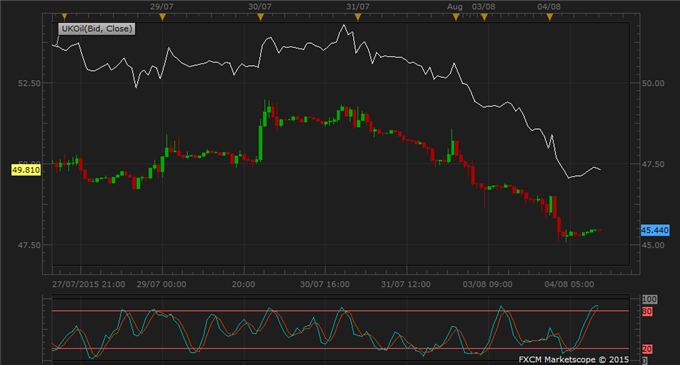
WTI and Brent oil recovered in the Asian morning after a huge overnight sell-off. WTI lost 4.1 percent and Brent gave back 5.2 percent due to the China-led commodities rout and provisional Iranian oil. Baring new developments, both oil indicators may linger above yesterday’s lows, at 45.06 for WTI and 49.34 for Brent.
Looking ahead, oil may still decline further as U.S. refineries slow down during August-October for maintenance.
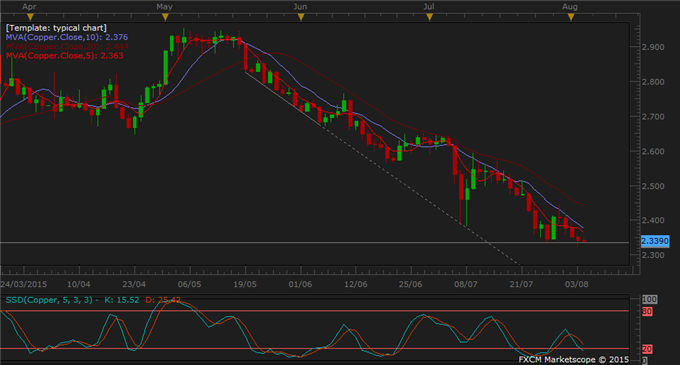
Copper continued to slide along with other metals under the impact of demand concerns after unimpressive PMI numbers from China and the US. Copper lowered to a fresh six-year low in the previous session. The metal market is awaiting further steps from Chinese government to stimulate growth, likely in the forms of interest rate cut or fiscal policy.
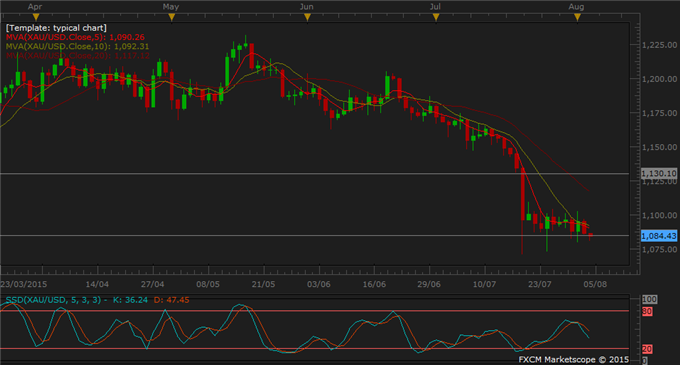
Gold carried on losses in Asian trade after data from the US hinted at modest support for growth and the case of higher interest rate. Investors also dropped precious metals as part of the commodities flight. Given steady demand from China and India, there is not yet an imbalance in the gold market that would prompt a decline past the 1071 level.
Data to watch: Commodity Index AUD slated for Australian afternoon.
GOLD TECHNICAL ANALYSIS – Gold has lowered on a third day of lower-high today, although it stayed firmly in range with a floor at 1071.2. Topside of intraday prices continues to be restricted by a resistance level at 1110. There is not yet a downtrend signal from moving averages. The gold bears may stick to range trades in the meantime.

COPPER TECHNICAL ANALYSIS – Copper completed a fourth day of lower-low in the previous session and broke a support level at 2.3360. Today copper prices have hovered above this level, although another breach is not ruled out. Downtrend signal in moving averages looks to resume and copper is poised to head lower. There is still plenty of leeway on the way down towards the May-August support trend line.

CRUDE OIL TECHNICAL ANALYSIS – The sharp fall in WTI oil halted by early Asian morning and prices have stayed elevated above yesterday’s low at 45.06. Intraday prices seem to enter a consolidation period in this proximity. Any topside extension during today or tomorrow sessions would provide the bears with opportunities to enter short positions.

