Talking Points:- WTI Oil dropped to the lowest since March as Iran prepared for post-sanction production
- Copper weakened after a flat China official manufacturing PMI
- Gold made small moves in reaction to US dollar
WTI oil opened in Asia trade near the previous session’s low and has lingered at levels last seen in March, below 47. It settled at 46.79 on Friday, making the biggest monthly loss since 2008. Brent oil led today’s decline at a 0.79 percent loss as it is testing January levels.
Sanctions against Iran should be lifted by late November, Bloomberg reported, citing a news agency for Iranian oil ministry. Its oil output can increase by 500,000 barrels a day within a week and by 1 million barrels a day a month after that, quoted the Iranian oil minister. This would further tip the scales against estimated lackluster demand out of China due to weak economic data.
There is no end to the oil bearish case with weak demand growth this year and a persistent supply glut. Shale well costs reduced 20-25 percent this year on declining drilling and lower energy prices. U.S. rig count grew steadily even as the summer driving season has peaked. Production is at record levels in Saudi Arabia and Iran projected extra output by the first quarter of 2016. Global refineries are running at peak levels.
Copper slipped on concerns that China demand may falter after the official manufacturing PMI came out lower than last month. The PMI index spotted right on the 50 threshold that divides contraction and expansion, hinting that more government support is needed to boost growth after a disappointing Caixin flash manufacturing PMI.
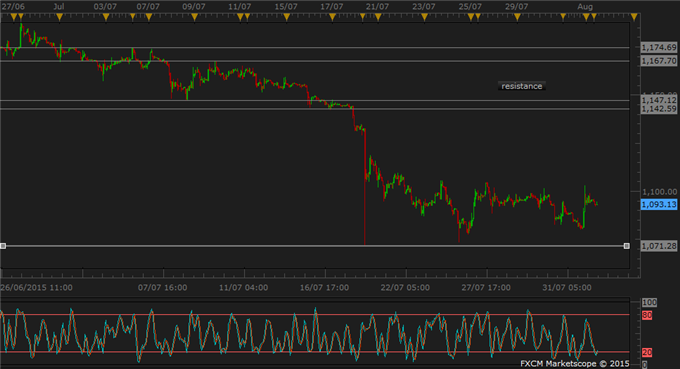
Gold retreated after late Friday’s gains and continued to be pulled by the market’s predictions of an upcoming U.S. interest rate rise. Intraday prices show a downside bias ahead of a firm support level and multi-year low around 1071. Given limited upside, gold prices mostly react to movements in the US dollar. Possible range trades would be to sell at rally for target near the support level.
GOLD TECHNICAL ANALYSIS – Gold is stuck in range with a floor at 1071.2 as upside extension remains limited while the recent downtrend has ran out of course. The gold bears may wear out this correction or play the range by selling at intraday highs for targets above the support level.

Chart Created Using FXCM Marketscope
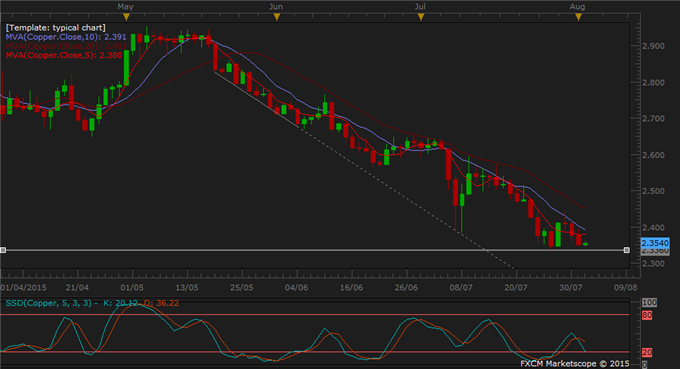
COPPER TECHNICAL ANALYSIS – Copper seems to keep on a correction period after the July’s sharp fall. Despite a daily downside bias, downtrend signal has not resumed and copper is expected to hold course with minor dips. The bears may sell into short-term rallies or stay put until copper breaks the support level at 2.3360.

Chart Created Using FXCM Marketscope
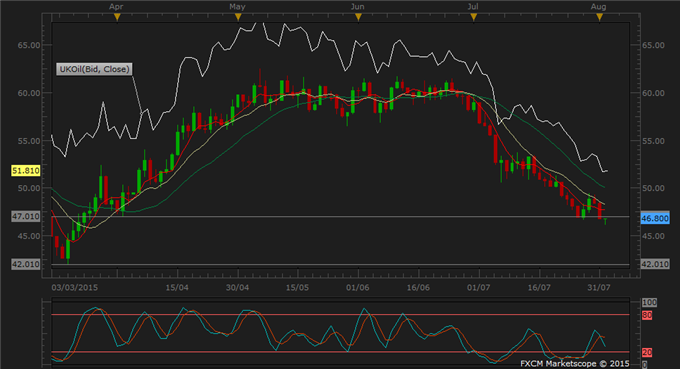
CRUDE OIL TECHNICAL ANALYSIS – WTI oil lowered past 47 mark in previous session and showed no sign for a retracement above that today. A floor is found at March’s low and this year’s low of 42. Moving averages still indicate a downtrend, which may resume in full force after the recent upward correction. Holders of short positions may keep their stops trailing the 10-day average.

Chart Created Using FXCM Marketscope
