Near term crude oil outlook:
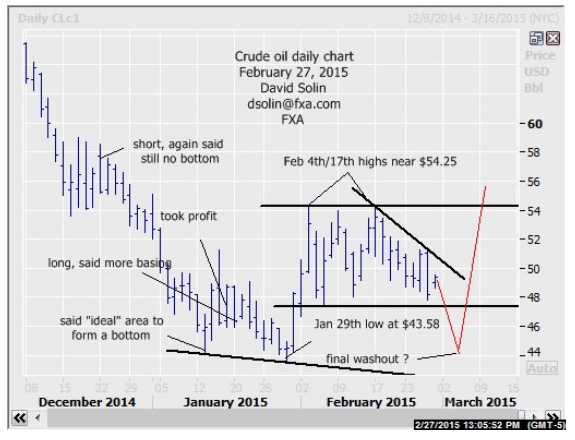
No change in the bigger picture view sign Jan of an important bottoming (see longer term below). However nearer term as been warning, there remains scope for a continued period of broader ranging as part of this process. Note that there is still no confirmation of a more important low "pattern-wise" (5 waves up for example) and the market has indeed continued to "fail" at that $54.25/75 area since early Feb. Additionally sentiment remains mixed/volatile (generally more bearish near important lows and a tendency to "fight" the initial stages of an upmove), while oil equities have mostly rallied sharply over the last month (another sign of optimism). So "ideally' would like to see a relatively quick, final move lower (not necessarily new lows below the $43 area) to "wash out" some of these weaker longs, and as part of this longer term bottoming (see "ideal" scenario in red on daily chart below). Nearby support is seen at $47.25/75 (base of range from Feb 4th), that $43.75/25 low and the falling support line from early Jan (currently at $42.00/50, likely max downside). Nearby resistance is seen at the bearish trendline from Feb 17th (currently at $50.75/00) and that key $54.25/75 area (clearly above would argue a more important bottom in place). Bottom line: important basing, but risk for a final, washout move lower.
Strategy/position:
Still long from the Jan 20th buy at $46.50, but with risk for a final washout lower, would just take profit here (currently at $49.40, for $2.90). However, will be looking to rebuy at $44.25 (just above that $43.58 low) and then initially stopping on a close $.50 below that falling support line from early Jan. Note too will also buy on a close above $54.75 if that occurs first (would argue a more important bottom is in place), then initially stopping on a close below $53.45 (would argue false break of he $54.25 highs).
Long term outlook:
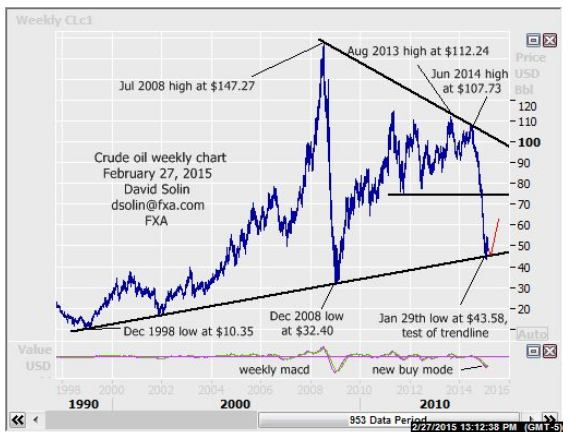
As discussed above, a bottoming for at least a few months is still seen in process as lots of positive signs remain. They include an oversold market after the tumble from the June high at $107.73, bullish technicals (see new buy mode on the weekly macd at bottom of 2nmd chart below), the seasonal chart that bottoms around now and rallies sharply (see 3rd chart below), and the key bullish trendline from Dec 1998 which remains near recent lows. These also support the view that even another near term push lower/washout, would likely be limited in the bigger picture and part of this larger bottoming. Bottom line : bottom for at least a few months still seen forming.
Strategy/position:
With the market seen in process of an important bottoming, would stay with the longer term bullish bias that was put in place on Jan 20th at $46.50.
Current:
Nearer term : long Jan 20th at $46.50, took profit Feb 27th at $49.90 (for $2.90).
Last : short Dec 22 at 57.25, took profit Jan 16 above t-line from Nov (46.75, closed 48.68, for $8.56).
Longer term : bull bias Jan 20th at $46.50, but magnitude/shape of the longer term upside a question.


