The industry’s appetite for oil has simply become insatiable over the last six months.
Indeed, the United States is producing and importing more oil today than it was a year ago, despite oil prices plunging more than 50%.
And this immense level of production is making it very difficult for prices to recover in any significant way.
Still, many are clinging to the bright side and calling $43 per barrel the bottom. Prices have rallied more than 20% off their lows…
But all you need to do is look at the data to get a reality check to the gut.
As each day passes, inventories continue to get fatter, and consumption numbers aren’t rising to match the supply.
Count the Calories
Despite the hopeful whispers of a price bottom, examining the data will quickly give you a clear picture of what’s really happening.
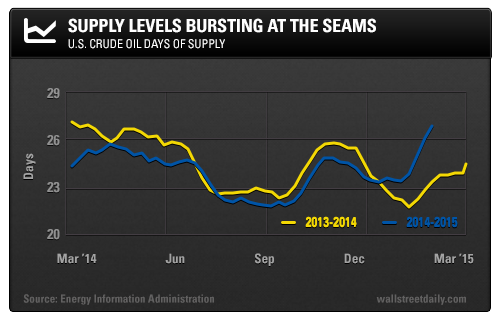
The chart below shows the number of days of supply sitting in pipelines, storage facilities, and tankers over the past five months. And it’s not a pretty picture…

At this time last year, we had around 24 days’ worth of supply. Today, that number is closer to 28.
If the supply numbers were trending lower in the face of low oil prices, then I could understand the argument for a bottom. However, the numbers are still trending higher.
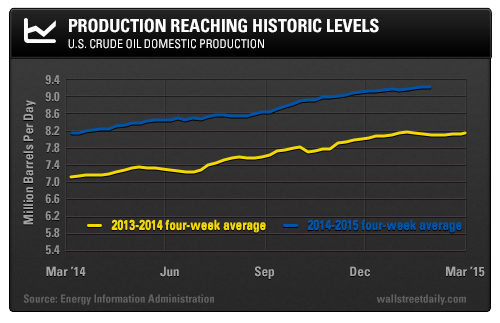
That’s because supplies are increasing, despite lower rig counts and lower imports. In fact, the United States is producing more barrels of oil per day now than in decades!
The one-year chart below is quite astounding. It shows domestic production increasing from around 8.2 million barrels per day to 9.2 million barrels per day.

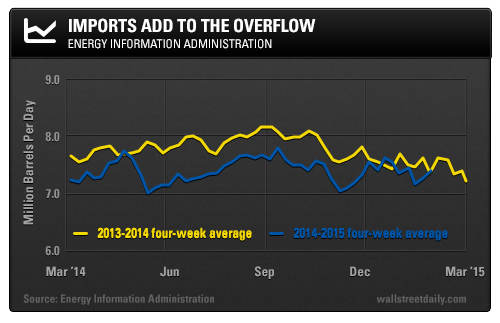
This next chart shows that imports have risen, as well, year over year, but not at the same rate as domestic production.

According to the Energy Information Administration (EIA), oil production outside of OPEC grew by more than two million barrels per day in 2014. And there seems to be no sign that the production growth rate will taper off until the end of 2015.
Last week, traders were expecting stockpiled inventories to build by 3.25 million barrels. The actual number came in at… 6.33 million barrels!
Cutting back future drilling plans is definitely in the cards, but current drilling still continues unabated.
Constant Consumption Necessary
Many, if not most, of the shale plays are hugely unprofitable at current prices, but the companies have no choice but to produce. That’s because they are bound by contractual obligations to use rigs, pay for service, and to deliver on oil they promised to sell via futures.
More importantly, they need to produce to survive…
Most frackers are highly indebted. The companies borrowed a ton of cash to drill for oil when prices made sense.
Leverage works well in a high-priced environment when margins allow for profits. But, in today’s environment, frackers are losing money on every barrel. Thus they’re forced to produce as much (or more) just to keep the lights on and the creditors at bay. The natural gas industry endured this same scenario for almost five years before price trends shifted higher.
With all this, the industry is making history these days (unfortunately)…
Since 1983, the average amount of oil in inventory at this time of the year was from 340 million to 360 million barrels. Today, that number is over 410 million barrels.
Yet, while domestic production keeps growing and imports are flat to up, the amount of oil consumed hasn’t been able to keep pace.
Relief Far From Sight
Greater usage efficiency combined with alternative sources of energy, such as natural gas, is putting even less pressure on the demand for oil.
The level of demand is something that lower prices can and will solve over time, though.
Take the current plunge in gasoline prices as an example. It appears that the money Americans are saving at the pump is going back into more gasoline purchases. Lower prices are translating into more time spent in the car for leisure activities and longer trips. And driving is once again competitive with flying or taking the train.
Oil prices are low, and they look to stay low for some time, at least for 2015. While some are calling for a rebound to $80 per barrel as quickly as this summer, others – like analysts at Citigroup (NYSE:C) – are calling for oil to possibly break down to $20 per barrel.
I think oil prices will remain subdued. And while there might be spikes that go higher or lower, prices will likely remain between $40 and $60 until 2016.
Not until we see the trend in inventories decline to levels less than 380 million barrels and production falls towards 8.5 million barrels per day will we see an earnest recovery in prices.
