Get 40% Off
🚨 Volatile Markets? Find Hidden Gems for Serious Outperformance
Find Stocks Now

Oh So Close To Oversold And 'Close Enough' To A Buy?

Published 09/30/2014, 01:28 AM
Updated 07/09/2023, 06:31 AM

T2108 Status: 23.7%
T2107 Status: 45.1% (exactly matches 7 1/2 month closing low set on Friday)
VIX Status: 15.98
General (Short-term) Trading Call: Hold (TRADERS REMAIN READY FOR WIDE SWINGS)
Active T2108 periods: Day #318 over 20% (includes day #280 at 20.03%, day #318 low at 20.25%), Day #5 under 30% (underperiod), Day #11 under 40%, Day #13 under 50%, Day #15 under 60%, Day #57 under 70%

Commentary
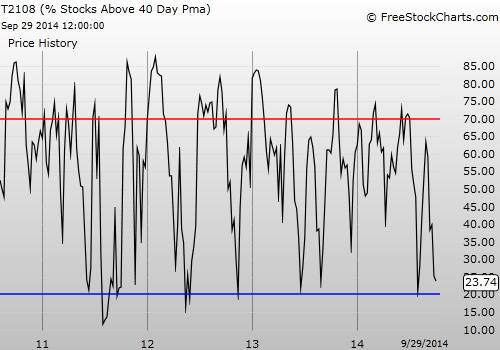
So yesterday delivered the gap down I was looking for on Friday. Still, T2108 did not quite reach oversold territory. It got as low as a tantalizing 20.03%.
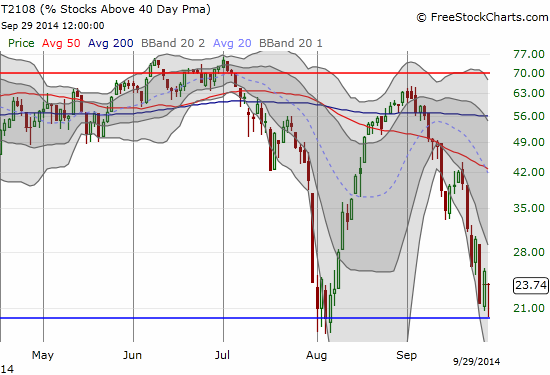
Close enough? Tantalizingly close to oversold

Close enough? Tantalizingly close to oversold before bouncing

T2107 also dipped. Unlike T2108, its intraday recovery only took it back to last Thursday’s close.
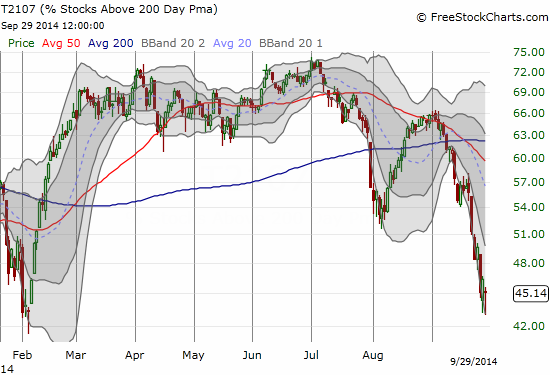
T2107 bounces but remains at a major low for year

T2107 bounces but remains at a major low for the year

The question now of course is whether this drop was “close enough” to triggering oversold conditions. The move off the bottom was too quick for me to react intraday. Moreover, I prefer a CLOSE in oversold conditions before lining up my trades on oversold conditions. To add to my hesitancy, the major indices, the S&P 500 (via SPDR S&P 500 (ARCA:SPY)) and the NASDAQ (via PowerShares QQQ (NASDAQ:QQQ)), are struggling at their 50-day moving averages (DMAs).
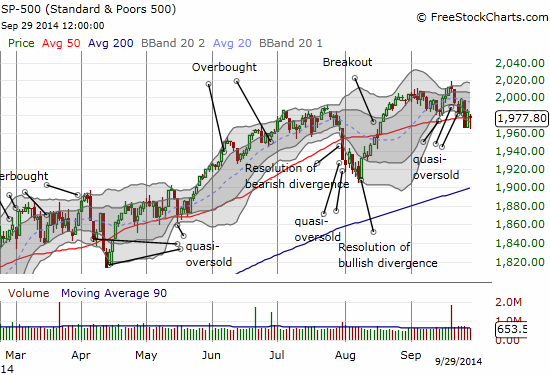
S&P 500 bounces right back to the 50DMA after gapping down

The S&P 500 bounces right back to the 50DMA after gapping down

Note that the S&P 500 does not show the proper open. SPY shows the gap down.
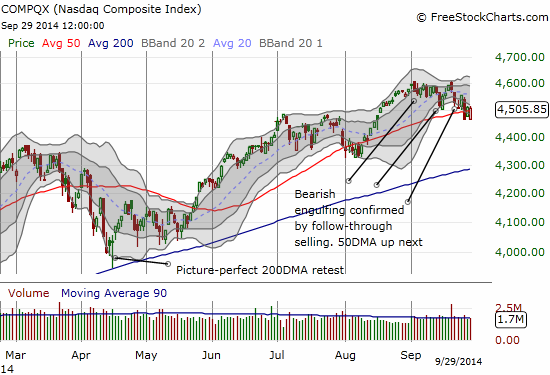
NASDAQ struggles to hold onto 50DMA support

The NASDAQ struggles to hold onto 50DMA support

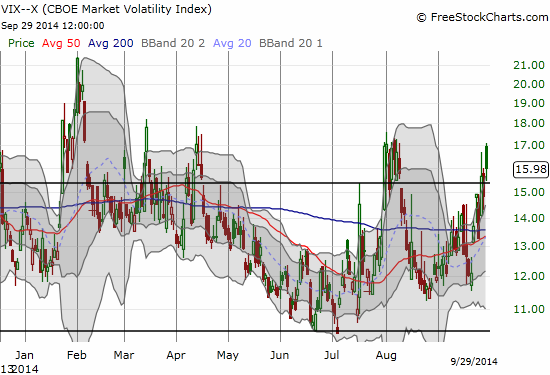
Finally, on the positive side, the VIX, the volatility index, gapped up and then failed to beat the high from August 1st that marked the peak of the last sell-off.
3rd party Ad. Not an offer or recommendation by Investing.com. See disclosure here or remove ads .

VIX fades right at resistance but remains above 15.35 pivot

The VIX fades right at resistance but remains above 15.35 pivot

So, on balance, the trading call remains on HOLD yet again. IF the indices manage a solid close above the 50DMA -meaning a close above Thursday’s high as well – I will feel comfortable assuming that oversold conditions are behind us. Ironically, I will feel even MORE comfortable initiating buys if the S&P 500 generates some more palpable fear with a large spike in the VIX, a T2108 below 18% (the low from the last sell-off), and even an S&P 500 that cracks September’s low. Stay tuned!

Daily T2108 vs the S&P 500
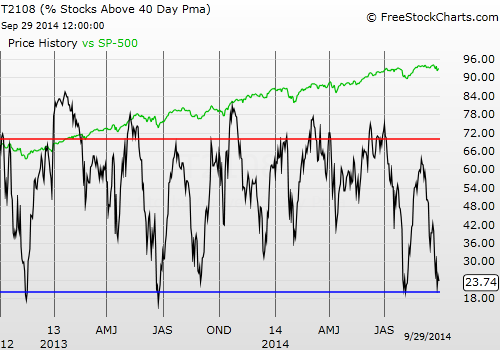
T2108 vs. the S&P 500 (DAILY)

Black line: T2108 (measured on the right); Green line: S&P 500 (for comparative purposes)
Red line: T2108 Overbought (70%); Blue line: T2108 Oversold (20%)

Weekly T2108
Weekly T2108

Be careful out there!

Disclosure: net short the Australian dollar

Latest comments

Risk Disclosure: Trading in financial instruments and/or cryptocurrencies involves high risks including the risk of losing some, or all, of your investment amount, and may not be suitable for all investors. Prices of cryptocurrencies are extremely volatile and may be affected by external factors such as financial, regulatory or political events. Trading on margin increases the financial risks.
Before deciding to trade in financial instrument or cryptocurrencies you should be fully informed of the risks and costs associated with trading the financial markets, carefully consider your investment objectives, level of experience, and risk appetite, and seek professional advice where needed.
Fusion Media would like to remind you that the data contained in this website is not necessarily real-time nor accurate. The data and prices on the website are not necessarily provided by any market or exchange, but may be provided by market makers, and so prices may not be accurate and may differ from the actual price at any given market, meaning prices are indicative and not appropriate for trading purposes. Fusion Media and any provider of the data contained in this website will not accept liability for any loss or damage as a result of your trading, or your reliance on the information contained within this website.
It is prohibited to use, store, reproduce, display, modify, transmit or distribute the data contained in this website without the explicit prior written permission of Fusion Media and/or the data provider. All intellectual property rights are reserved by the providers and/or the exchange providing the data contained in this website.
Fusion Media may be compensated by the advertisers that appear on the website, based on your interaction with the advertisements or advertisers.
© 2007-2024 - Fusion Media Limited. All Rights Reserved.