Get 40% Off
🤯 Perficient is up a mind-blowing 53%. Our ProPicks AI saw the buying opportunity in March.Read full update

NZDJPY Follows The Equities As Risk On/Off Indicator

Published 04/21/2016, 05:36 AM
Updated 01/31/2022, 02:45 AM

NZD/JPY is one of the pairs pair that has a strong correlation to equities. Nikkei and DAX are +92/90 correlated to NZD/JPY and that is extremely high correlation, so they are moving in the same direction. Most important yen crosses ( USD/JPY, AUD/JPY, NZD/JPY) are an excellent Risk ON/OFF indicator. As the rate of one currency increases relative to another, investors are attracted to the higher yielding currency.

Technically NZD/JPY is bullish but we see an inner trend line that has been broken with H4 perfectly aligned with previous swing. If we see H1 momentum above or H1 close above H4 camarilla pivot, the pair can make a bullish breakout to H5 and that is 77.54. If we see a pullback towards 75.64-80 zone (previous breakout point, bullish order block (A), 50.0,L5) the price could spike from POC towards 76.34 (L3), and further towards the H3 - 76.86. market is currently calm ( as expected ) so we might expect volatile session later during the day. We may expect a movement just before, during Draghi speech today or after.
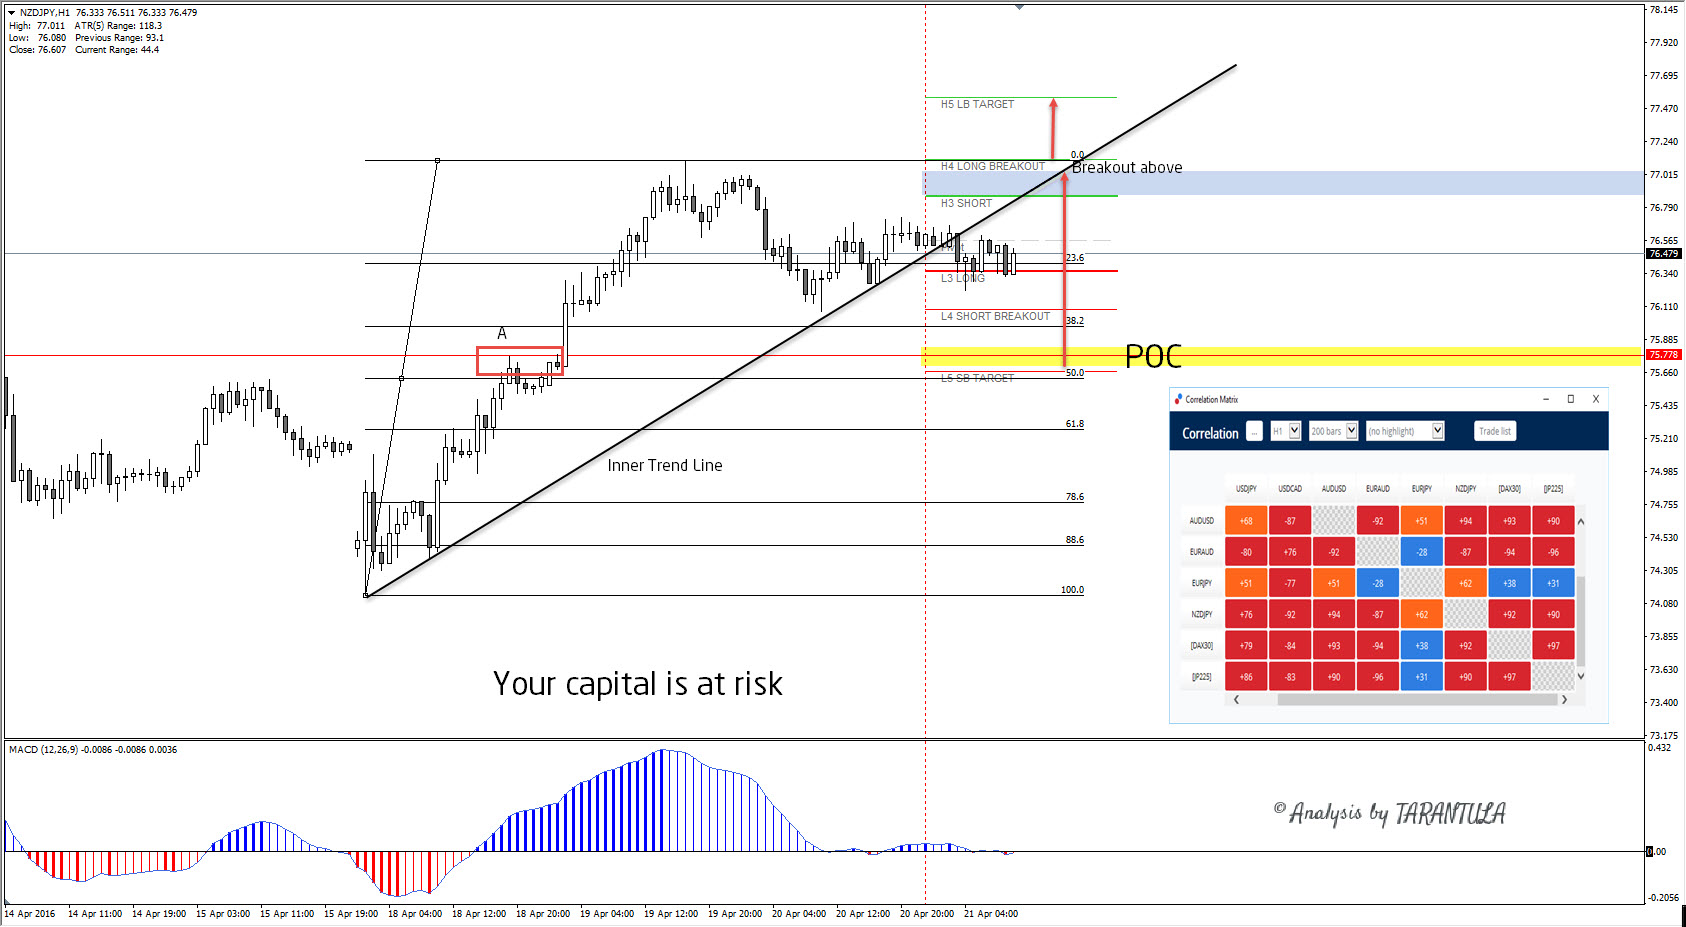
NZD/JPY Hourly Chart

Latest comments

Risk Disclosure: Trading in financial instruments and/or cryptocurrencies involves high risks including the risk of losing some, or all, of your investment amount, and may not be suitable for all investors. Prices of cryptocurrencies are extremely volatile and may be affected by external factors such as financial, regulatory or political events. Trading on margin increases the financial risks.
Before deciding to trade in financial instrument or cryptocurrencies you should be fully informed of the risks and costs associated with trading the financial markets, carefully consider your investment objectives, level of experience, and risk appetite, and seek professional advice where needed.
Fusion Media would like to remind you that the data contained in this website is not necessarily real-time nor accurate. The data and prices on the website are not necessarily provided by any market or exchange, but may be provided by market makers, and so prices may not be accurate and may differ from the actual price at any given market, meaning prices are indicative and not appropriate for trading purposes. Fusion Media and any provider of the data contained in this website will not accept liability for any loss or damage as a result of your trading, or your reliance on the information contained within this website.
It is prohibited to use, store, reproduce, display, modify, transmit or distribute the data contained in this website without the explicit prior written permission of Fusion Media and/or the data provider. All intellectual property rights are reserved by the providers and/or the exchange providing the data contained in this website.
Fusion Media may be compensated by the advertisers that appear on the website, based on your interaction with the advertisements or advertisers.
© 2007-2024 - Fusion Media Limited. All Rights Reserved.