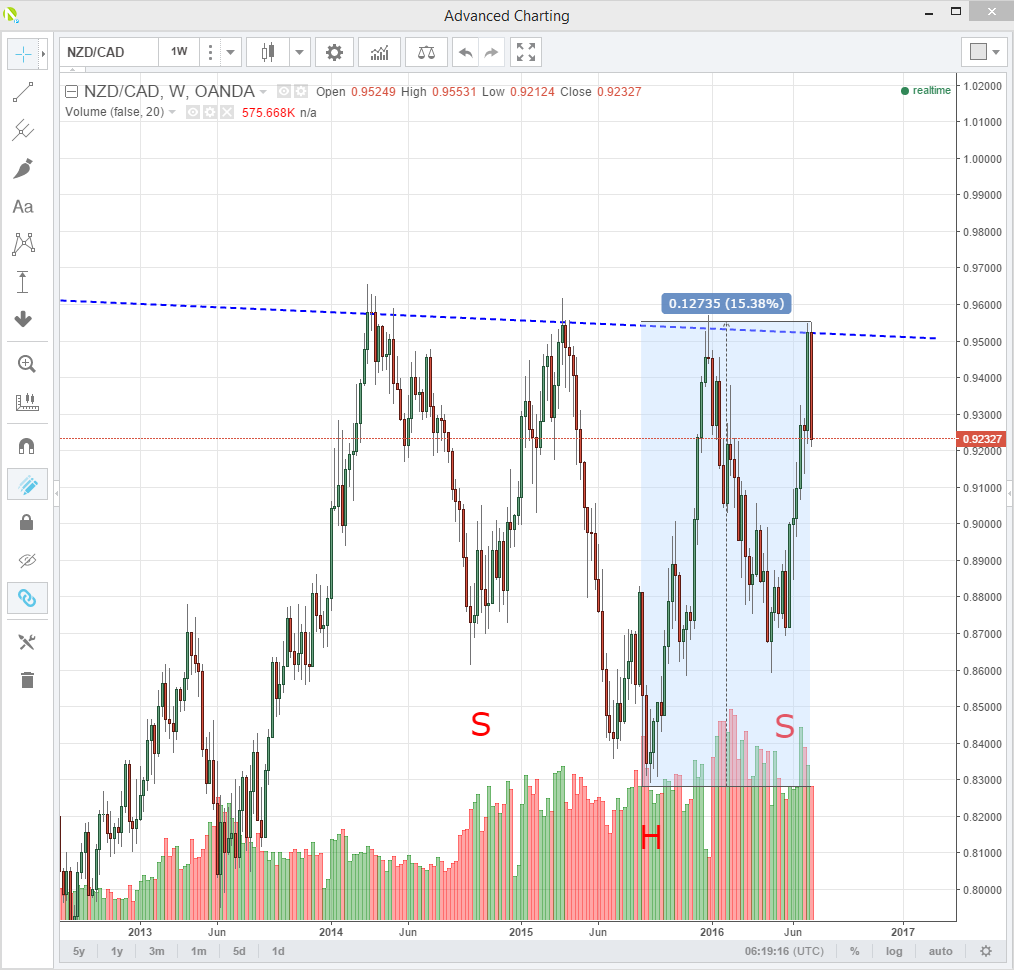
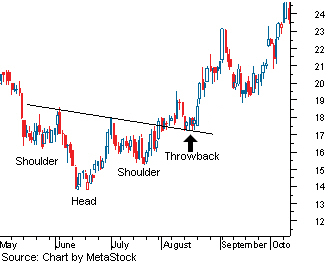
NZD/CAD showing a long term inverse head and shoulders on the weekly charts:
The overnight price action in NZD/USD post RBNZ announcement had me flicking through the various NZD/Cross pages on the OANDA FX Trade Platform today. No this isn’t a shameless plug. After three weeks at the coalface here, I have been stomping at the bit to show the benefits stepping out of the short-term noise in the markets. Looking at weekly and even monthly charts can often bring clarity to vision and spot possible opportunities.
One doesn’t have to be a technical analysis genius to do this, it’s often just doing the simple things well. The weekly NZD/CAD chart below is as classical as it gets, showing a huge inverse head and shoulders pattern that is well worth noting for longer term players.

We have two fully formed shoulders and a head as well as a well-defined neckline. S-H-S. Importantly the later part of the formation has been formed on high volume days, a point that many traders often overlook. The volumes are the red and green histogram bars along the bottom.
The neckline in blue dashes forms resistance at 9520 on a weekly basis but also the breakout point if we closed above on a weekly basis.The blue shaded box measures the distance from the head (even though it is upside down), to the neckline. In a perfect world, a SUSTAINED break above the neckline resistance at 9520, should lead to an up move of the same distance. In this case 0.1242 (see the blue box on chart) equaling a target of around 1.0860 over time.
For those of you who read my post on NZD yesterday, this ties in nicely with my thoughts that no amount of jawboning by the RBNZ can produce a sustained move lower in NZD/USD. We will need a very low print on NZ CPI next week and a cut from the RBNZ to do that. New Zealand’s status as on of the last developed market “yielders” will ensure that teeth continue to be gnashed at central bank HQ.
Important Caveats
1. A breakout is often followed by a period of consolidation above the neckline, which now becomes support.

2. The neckline is resistance. It’s resistance until it closes above on a weekly basis in this case.
3. If it closes above, consolidates for a few weeks and then drops back underneath it is invalidated.
4. This is a weekly chart. It has taken two years for the formation to develop and thus “patience” may well be required, should the breakout happen in a classical way.
If you are not a purely technical trader there are many other variables to consider. Oil, Fed hikes or not, NZ CPI this week, Canadian rates and lets do not forget a US Presidential election this year. The often overlooked potential black (orange?) swan of 2016.
Nevertheless, to my mind, this represents an excellent example of stepping out of the short term noise, a classical technical analysis formation and doing the simple things well.
by Jeffrey Halley
