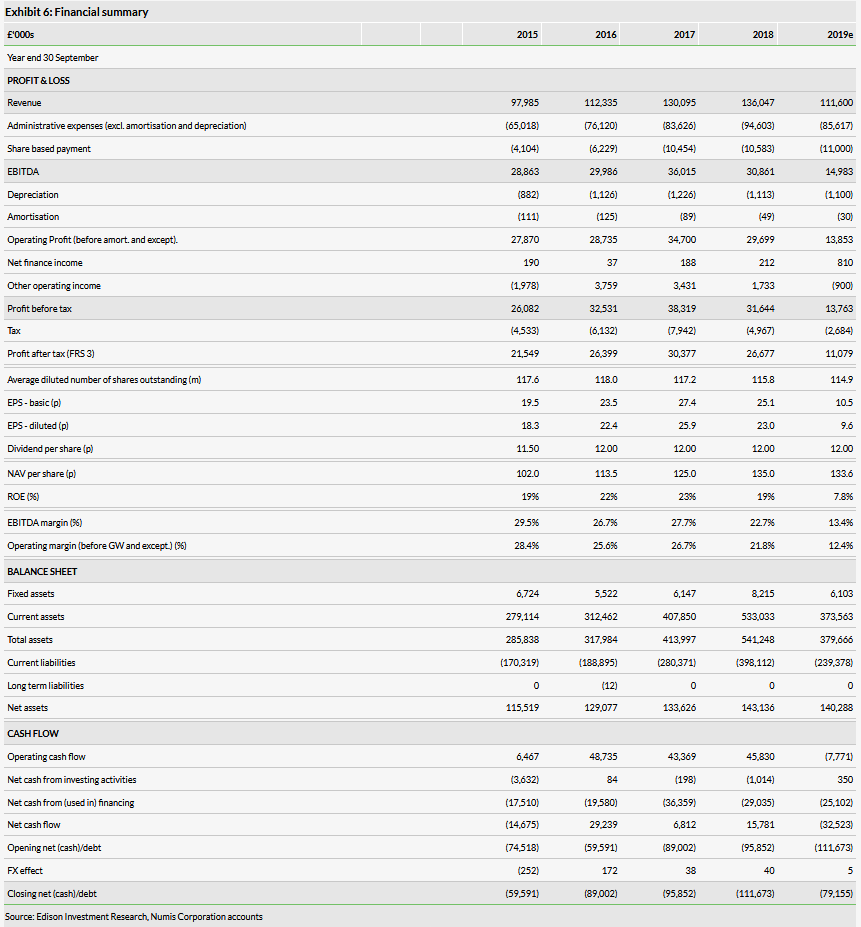
Numis (LON:NUM)’s year-end update confirmed that the low levels of corporate activity seen in the first half persisted through the rest of the year. In these circumstances, matching first half revenues can be seen as a reasonable outcome for H219. FY19 revenue and profit are therefore set to be significantly lower y-o-y, but the franchise remains strong, with positive indicators including increases in corporate client numbers, private market revenues and market share within Equities. The potential for a substantial bounce back in earnings once conditions improve remains in place. In the meantime, reassurance is provided by the strong balance sheet position and continued commitment to developing the franchise.

FY19 trading update
Numis’s full year trading update indicated that second half revenues remained in line with the first half. Full year revenues are therefore expected to see a mid- to high-teens percentage decline y-o-y with profits falling further given the impact of operational gearing. Investment banking has been particularly affected by lower M&A and capital markets activity, while equity trading activity has also been depressed. Positively, the number of corporate clients increased from 210 to 217 during the year. Numis’s Equities business saw an improvement in second half revenues as the trading book performed better, and execution and research income was maintained, implying some market share gain here. Private markets transactions, an area in which Numis has invested, increased revenues and included a $460m fund-raise for Klarna, the Swedish fintech business. Other points from the update are noted overleaf.
Background remains uncertain
While the UK’s political impasse continues, strategic business decisions are likely to be deferred and reduced capital markets activity to continue. However, with a corporate client list now standing at 217, and an equities franchise that has proved resilient and appears to be gaining share, Numis is well placed to benefit when greater certainty returns to the market.
Estimates adjusted to reflect flat H2 revenues
Reducing our revenue assumption to match the flat revenues expected in the second half has an operationally geared impact on our FY19 EPS estimate, resulting in a 24% reduction. Subject to any decision to invest further in the franchise, the gearing on a recovery in revenue should be equally marked.
Business description
Numis is one of the UK's leading independent investment banking groups, offering a full range of research, execution, equity capital markets, corporate broking and advisory services. It employs c 270 staff in offices in London and New York, and at the end of September 2019 had 217 corporate clients.
Other points from the update
Costs have been contained with the headcount held steady, but longer-term growth plans and strategy remain in place.
With the existing London office lease approaching expiry, a lease for larger new office space has been signed. Relocation is expected in the second half of FY21 involving a £3m increase in annual property costs (including the impact of IFRS 16) and, we assume, some temporary double running costs.
Estimate revisions
The changes in the headline figures from our estimate are set out in the table below and further details of the new estimate are shown in the financial summary. Our previous estimate allowed for a modest improvement in second half revenues and the new forecast adjusts to a flat outcome versus the first half. On costs, our assumption for fixed staff costs is little changed and we had already allowed for a compression of variable compensation as a percentage of pre-bonus profit. Operational gearing means that pre-tax profit and EPS estimates are 24% below our previous estimate.

Trading background
The two charts below show the value of new and further issuance for the London Stock Exchange Main and AIM markets. For the 11 months to end August, the value of Main market new issuance was 20% ahead of the prior year period, but this was much more concentrated in fewer names as the number of issues fell by 14%. The value of further issuance was broadly flat. On AIM the picture has been much more depressed with the value of new and further issuance down 65% and 47% respectively.
Exhibit 2: LSE main market new and further issuance
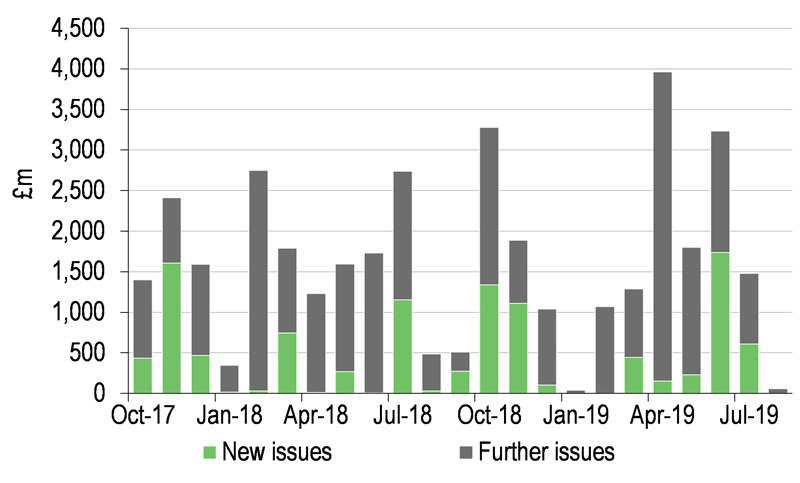
Exhibit 3: LSE AIM new and further issuance
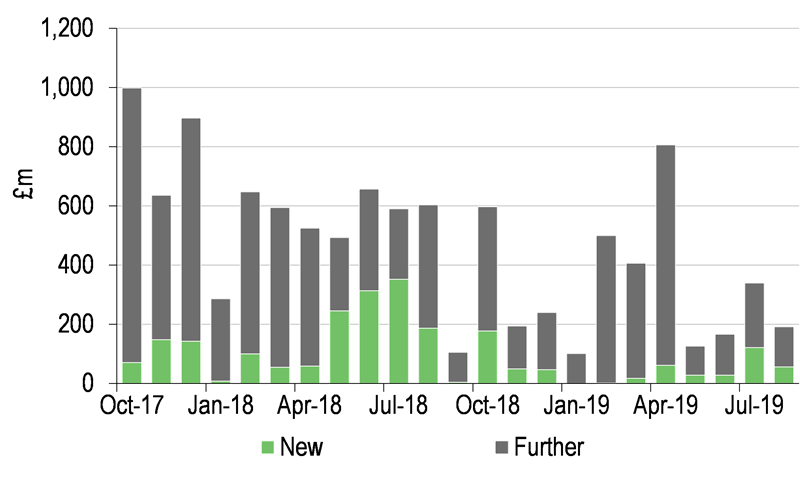
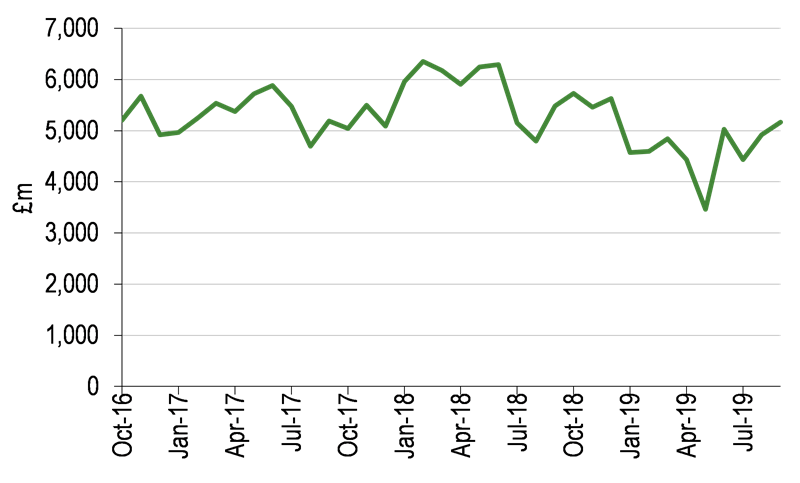
Exhibit 4 illustrates recent equity market performance highlighting the relative weakness of the FTSE All-Share AIM index (-19% over 12 months), which undoubtedly fed into the weakness in issuance shown above. The FTSE All-Share and Small Cap indices are little changed over 12 months. The second chart shows the trend in London Stock Exchange order book trading; in the last 12 months the average daily value traded was down 7%.
Exhibit 4: FTSE AIM, All-Share and Small Cap indices
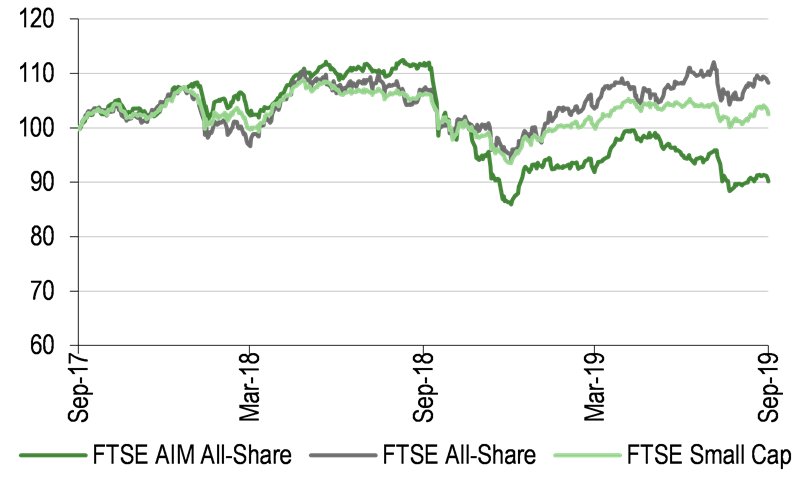
Exhibit 5: LSE order book, average daily value traded
